
Let’s explore the complexity and vulnerability of IT infrastructure and how to build a modern IT infrastructure monitoring solution, using a combination of time series databases with machine learning.
IT Infrastructure: Complex and Vulnerable
iCloud recently joined Google, Facebook, Amazon on the list of major companies that have experienced massive cloud outages. Check out ZDNet’s series of articles detailing the outages. The outage caused disruptions to the likes of YouTube, Snapchat, and Gmail, among others.
iCloud’s failure also affected all their third-party apps and ApplePay, which resounded globally. We have quickly embraced the cloud as more resilient than on-premise infrastructure, so this news is sobering. It also shows the vulnerability of the IT infrastructures, both cloud-based and on-premise, that power much of our software-dependent world — a world that now includes entertainment and personal, as well as professional connections.
IT infrastructure encompasses all related components, including network, security, storage, operating systems, links to hubs, and computers. Each component has numerous subcomponents, such as memory, central processing units, etc. On top of that, cloud adoption and virtualization add more intricacy. Software-defined networks make fast and automatic infrastructure changes, making it harder to track which workload resides on which virtual machine and correlate them to the physical server. Measuring the impact of one machine’s performance at any given moment becomes a serious challenge!
In this digital age, companies (and people!) are dependent on good infrastructure to power their critical functions like communication, financing, etc. Downtime is costly and damaging to a business. This puts increased pressure on companies of all sizes to reconsider their infrastructure-monitoring strategies. How can you effectively monitor the sprawling, distributed IT components that continue to scale with business growth?
Predictive Infrastructure Monitoring with Time Series Databases and Machine Learning
Current monitoring tools are typically vendor-specific, siloed, and lack a comprehensive view of the whole infrastructure landscape. With growing volumes and variety of data, they can create bottlenecks and blind spots. These challenges demand a new design, one that is built for distributed computing, data collecting, and parallel processing at scale, and one that can learn from history and predict downtime for outages.
The building blocks of designing a modern IT infrastructure-monitoring platform that enables predictive analytics include the following multi-step process:
1. Collect and pre-process the data:
a. Gather data in real-time from various sources including syslog, network traffic logs, event logs, and metrics such as throughput, IOPS and latency.
This step is challenging as applications generate data in various formats, store it in different frequencies and the APIs to get the data differ from one application to another. You will need a framework that sustains data collection at scale with a wide range of supported protocols and data formats. Event-driven frameworks like Nuclio, OpenFaas, AWS Lambda, Azure Functions and others address these challenges by handling all the operational heavy lifting needed for data collection. Keep in mind that in addition to real-time data there is also a need to collect batch data continuously for lookup tables (e.g. device tables).
b. Enrich data on the fly to prepare the data for faster analysis and to provide additional insights by leveraging external data sources. This requires a very fast mechanism that runs real-time streaming data and additional dataset joins while sustaining millions of events per second.
c. Store large sets of time series data in a time series database (TSDB). This works especially well when the number of events per second is significant. The data is immutable and records are inserted as opposed to updated, creating a new row for every change in the system. TSDBs are an efficient solution for large volumes of real-time data and also provide a query engine optimized for time-based queries. That said, not all data should be stored in a TSDB. Customers often have lookup tables for data enrichment and joining the data between the two formats is required. In those cases, it makes more sense to store lookup tables in a relational or a key value table structure, while optimizing joins running in real-time for key access so that loads are sustained.
2. Explore data
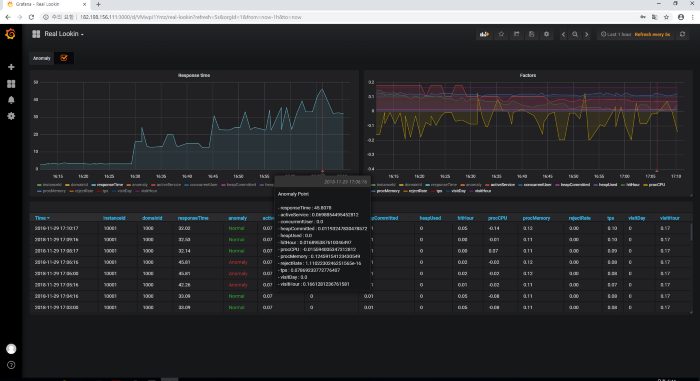
You can explore data in various ways. It is very common to use Prometheus, the popular open source TSDB, to leverage its query engine for time-based queries. However, Prometheus is not scalable and can’t store or analyze large data sets. Distributed data platforms with scalable data layers are needed to address these challenges, storing and analyzing data while using the Prometheus interface. You can then use visualization tools to generate interactive reports on top of Prometheus (e.g. Grafana).
3. Gain actionable insights using ML:
The final goal is to gain insights that serve business requirements. Traditionally, this was achieved with tools based on rules (e.g. rule-based) which triggered alerts and events upon specific sets of events. For example, notify the admin if the average temperature in a 5-minute time frame exceeds a certain threshold. But customers are looking for more advanced machine learning and predictive analytics solutions, which identify anomalies based on large sets of metrics to find correlations. While machine learning and predictive analytics enable much more than rule-based systems, businesses still face operational challenges involving scale and performance.
Does that all sound complicated? Luckily for us, some are thinking ahead for modern solutions. Today’s end-to-end data science platforms have made the process of creating your own intelligent solutions easier. Robust data science platforms, like Iguazio, offer integrated tools to design your own real-time infrastructure-monitoring solution, one that goes beyond the traditional reactive TSDB.
A data science platform that is capable of monitoring modern IT infrastructure will deliver:
● Sophisticated, real-time predictions
● Tools that correlate time series data, run algorithms, and generate interactive dashboards and recommendations for actions
● Robust TSDB engine, compatible with Prometheus and other popular TSDB APIs
● Versatility to operate in the cloud, on-premise, or at the edge
● Flexibility for users to use a favorite analytic framework (e.g. Spark) or dashboarding tools (e.g. Grafana) without restrictions
● Cheaper, streamlined ways to accommodate high volumes of data and add relevant historical data
● Support for multiple data models
● Secure data sharing enabled without compromising privacy and data governance; using authentication, data security, “dark-site” and offline deployment
The chaotic news of the cloud outages underscores the importance of having a sophisticated monitoring strategy for your IT infrastructure. A Business Insider article suggests Google’s high-profile outage will impact their market share. Google sold itself on reliability and the outages may leave the company trailing behind its nemeses, Amazon and Microsoft.