
In this article, we will see how we can implement a simple customer churn model that is built by using Azure Machine Learning studio. This article will give us a starting point to understand how Azure ML based models are created and deployed in the most easy to understand manner. The experiment (Azure ML Model terminology) that I will refer to is based on a dummy customer data and is readily available on Azure ML Studio AI Gallery.
Understanding the Churn Problem
In today’s competitive world, businesses are dealing with behemoth problem of customer churn forcing businesses to take policy and product related decisions, which as a result, often leads to financial losses. To tackle this problem of “Customer Churn” a lot of businesses are creating and deploying various predictive models to quarantine potential churners by devising outreach programs once these populations are identified with the help of these models.
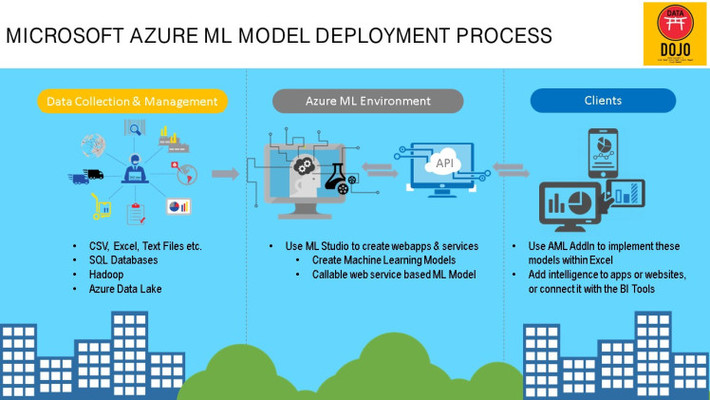
In this article we will use a two class Logistic Regression module that can be used to predict two (keep in mind – only two) outcomes. Logistic regression is a very popular classification model that can predict the probability of occurrence of an event by fitting data to a logistic function. Before we get into the mechanics of creating and deploying this model, let’s understand the Azure ML Workflow.
Now that we have looked at the very basic Azure ML Model workflow, we will learn how create a customer churn model and deploy it as a webservice and use it to predict an outcome within Excel using the AML addin.
Let us look at the key elements to create this model workflow in Azure ML Studio:
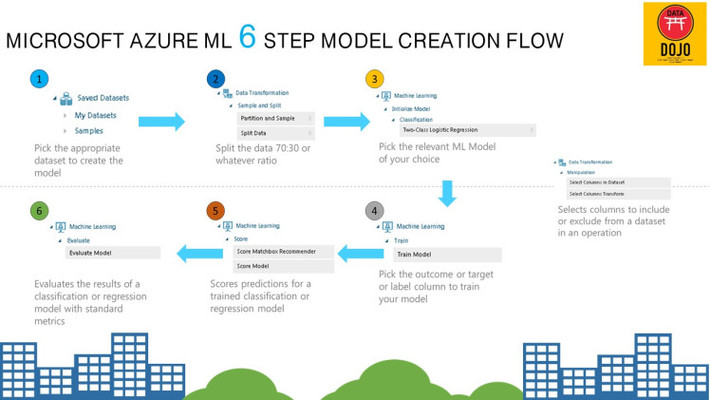
Azure ML Model Workflow View
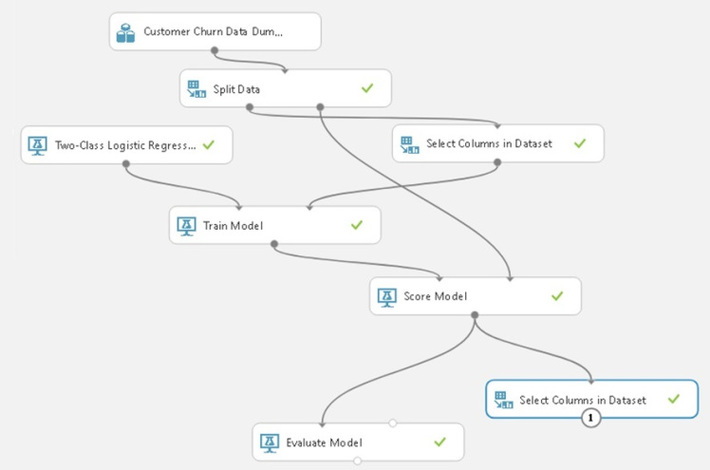
Once the model is created hit the run icon located at the bottom of the Azure ML studio console (refer to the image below)

Once clicked the model will be trained scored and evaluated based on the flow that has been created.
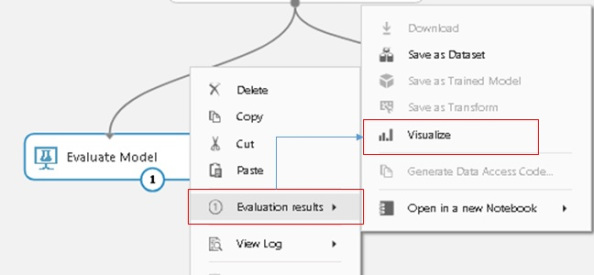
In order to evaluate the model do a right click on the Evaluate Model widget and select Evaluation Results and Visualize as shown in the image below.
This will open the Evaluate Model Results Page as shown in the image below. Considering the fact that the data that I am working on is dummy dataset it is pretty evident that due to data syntheticness (artificially generated data) the model performance is not that great. The model is just better than a fair coin toss.
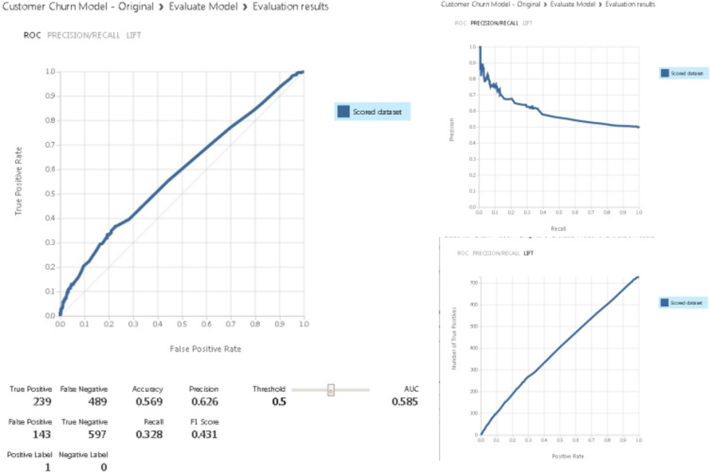
There are multitude model evaluation metrics that are generated especially for the classification model (please refer to the above images). This AML (Azure ML) widget provides the capability to compare various models to pick and choose the most efficient model for deployment. The model comparison process is out of the scope of this article.
However, for tutorial purposes, we can clearly see that how easy and simple it is to generate and evaluate the model performance within Azure ML Studio environment. One point to be considered, in order for anyone to generate a quality and deployable model basic understanding of model types and their usage, feature reduction techniques, hyper-parameter tuning is necessary.
Metrics for classification models
The following metrics are reported when evaluating classification models. If you compare models, they are ranked by the metric you select for evaluation.
- Accuracy measures the goodness of a classification model as the proportion of true results to total cases.
- Precision is the proportion of true results over all positive results.
- Recall is the fraction of all correct results returned by the model.
- F-score is computed as the weighted average of precision and recall between 0 and 1, where the ideal F-score value is 1.
- AUC measures the area under the curve plotted with true positives on the y axis and false positives on the x axis. This metric is useful because it provides a single number that lets you compare models of different types.
- Average log loss is a single score used to express the penalty for wrong results. It is calculated as the difference between two probability distributions – the true one, and the one in the model.
- Training log loss is a single score that represents the advantage of the classifier over a random prediction. The log loss measures the uncertainty of your model by comparing the probabilities it outputs to the known values (ground truth) in the labels. You want to minimize log loss for the model as a whole.
Now we will come to the most interesting part of this tutorial i.e. setting up the model as a webservice and making predictions using AML Excel Addin.
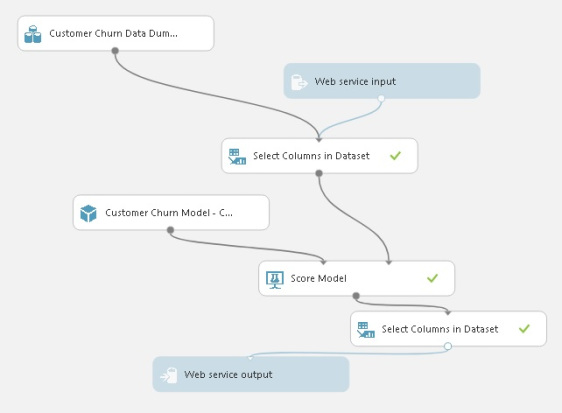
Once we are satisfied with the model’s performance by performing feature reduction routines and going through multiple cycles of hyper-parameter tuning activities via the inbuilt “Sweep Parameters” widget. To get this model ready for deployment, we need to convert this training experiment to a predictive experiment. This involves three steps:
- Save the trained model
- Trim the experiment to remove module that were only needed for training
- Define where the webservice will accept input and where it generates the output, this can be done by using the Select Columns in Data widgets as illustrated in the above “6 Steps Model Creation Flow”.

- The trained model is converted to a single Trained Model module and stored in the module palette to the left of the experiment canvas (you can find it under Trained Models)
- Modules that were used for training are removed; specifically:
- Two Class Logistic Regression
- Train Model
- Split Data
- The saved trained model is added back into the experiment
- Web service input and Web service output modules are added (these identify where the user’s data will enter the model, and what data is returned, when the web service is accessed)
Web service input and Web service output modules are added (these identify where the user’s data will enter the model, and what data is returned, when the web service is accessed)
As illustrated in the final model image below, I have added and connected the “Select Columns in Data” widgets with both Web Service Input and Output widgets to better define the model schema and to ensure that I get Score Labels and Probabilities only as an output when this model is run.
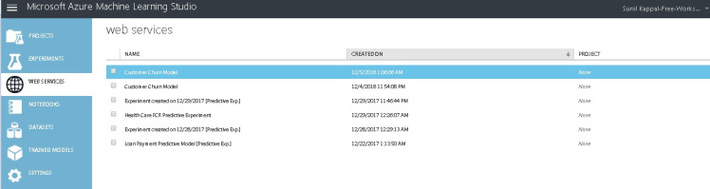
 Now that our model has been deployed as a web service, we can go to the Web Service area of Azure ML studio and access the fully functional model which is ready to predict.
Once clicked on the highlighted churn model, it took me to the Customer Churn Model Dashboard Section for model consumption. Here, I can not only Test how the model is working by clicking on the Test button listed next to “Request / Response” and “Batch Execution”. I can also download the Excel file to make predictions on the new data.
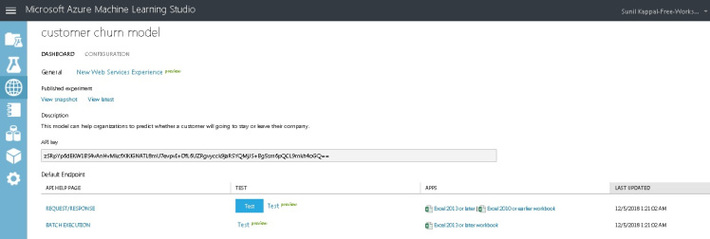
Note: Keep in mind that the user should have AML plugin installed in his or her version of Excel to use the deployed churn model. Below is the link that further explained how to consume Web Service in Excel.