
Even today there seems to be considerable debate over the exact meaning of “stress.” During my graduate studies, I pointed out that there are similar themes in the literature pertaining to stress; that perhaps researchers have been overemphasizing the differences. Among the most persistent themes is the distinction between stress and stressors. Hans Selye asserted in 1936 is that stress is an internal response against any form of noxious stimulant. He described the environmental factors contributing to stress as stressors [1]. This is an important distinction with implications to the meaning of data as I will soon elaborate. However, before continuing down that road, I want to suggest that perhaps a number of diseases can be described as “internal responses” to conditions in the external environment. For example, in the case of breathing problems and air pollution, having difficulty breathing can be characterized as one’s “internal response” to the stressor. Despite the apparently critical role of the external stressor, much more emphasis tends to be placed on the body as it relates to the disease than on the circumstances bringing about illness. The problem with stress is that people have different tolerance levels; and so the response cannot be directly attributed to specific environmental conditions. But this is true of a canister of nerve agent being tossed into a crowded subway: there will likely be bell curve of ensuing fatalities and injuries in light of varying tolerance levels. One must not dismiss the relevance of the nerve agent – that is to say, of stressors, as some professions seem have done [2]. In any event, I agree with the argument that a balanced approach should consider both the internal response and the external stressors [3].
There is an acknowledgement of external stressors. Yet science has tended to focus on the internal response. Why might this be? Some people might find it unusual for a medical doctor to try to advocate for changes to the environment: 1) doing so seems political; 2) such efforts seem to draw attention away from the doctor’s area of expertise; and 3) the methods available to study the body’s environmental interactions are debatable. Consider the third point which probably involves the development of data systems and methodologies. Imagine a patient complaining of breathing problems: what methods could be used to examine his or her interactions to the environment? The doctor might ask a few questions. The patient hopefully can offer a few answers. The doctor would likely use the instruments at hand to do some on-site checking: his or her own ears . . . I’m thinking a stethoscope to amplify breathing noises in the chest, apart from checking the heart of course. I point out that actually, on close examination, some doctors likely have minimal data on their patients. As such, I personally don’t consider it unusual for a medical professional to focus on symptoms – that is to say, measuring and treating the internal response – since it can at least be observed and objectively confirmed. How is it that a person can objectively confirm something internal?
Irony of the Internal Response
I recall a recent discussion involving female passengers on the TTC. “TTC” usually refers to the transit system operated by the Toronto Transit Commission. There were complaints of unwanted touching by some female passengers. I recall a spokesperson for the TTC on television explaining how difficult it can sometimes be to collect assault data given problems surrounding the definition: e.g. when is something a sexual assault? I suppose that it can be difficult to collect “criteria-based” data on sexual assault. But this is not the only data that can be collected. In prior blogs, I said that I gather criteria-based data as part of my day-to-day duties. Arguably in relation to criteria, the body as a source of data isn’t really the subject but rather the data’s object. There is probably a great deal data pertaining to the experiences of female passengers that could be gathered; however, this is data of phenomenology and self-expression rather than specific criteria such as sexual assault. It might lack the instrumental facets of criteria-based data – often described by me as “control data.” I find that the internal response to stressors is usually entwined in criteria, purpose, and function. The story of the victim seems almost secondary. The so-called “internal response” of the body therefore reflects rather ironically an external recognition process; this is substantiated to some extent by the countability or quantitative expression of events.
I therefore suggest that a focus on the body tends to indicate a preoccupation with criteria. Further, “pathology relating to the body” should be carefully examined to ascertain whether the characterization of disease isn’t actually “pathology relating to criteria surrounding the body.” Consider for example a physiognomic evaluation of visible minorities by Nazis: it is possible to arrive at criteria in a logical manner despite great subjectivity and nonsense in one’s assertions. Nazi quasi-intellectualism led to the imposition of criteria over reality, labeling other people as diseased and inferior. Thinking perhaps in less critical terms but applying the same conceptual dynamics, I believe it can be tempting for researchers to regard phenomena through the lens of criteria. The need to control things brings the attention of the researcher to the body – the way the owner of a production facility closely monitors employees on a bodily level – the way a Nazi doctor might closely examine the foreheads of people belonging to different races. Control data asserts and perpetuates normalcy; and it is against this normalcy that aberrations are measured.
The treatment of people through the use of criteria seems most problematic when assertions of normalcy are doubtful: for example, in relation to a diverse, multi-racial population of varying economic strata, varying levels of education, age, and physical ability. It becomes evident that the body is merely an object in the analysis. The doctor might attempt to assert “normal weight” or “healthy diet.” Based on what data – a survey or study of millions of people? Still, I am not questioning such assertions, although the numbers and recommendations seem to keep changing. I am merely pointing out that the focus on the body hardly seems to be about the body at all but rather its control through criteria. The body is inseparable from the environment that it occupies. Illness to the environment is likely to bring about illness to the body. Doctors focus on the body. My focus is on embodiment – what it means to exist as a person in one’s habitat. Consequently, being sensitive to a person for me is about understanding that person’s embodiment. To have a great deal of data on bodies as an aggregate can confirm “internal compliance.” But if the environment is toxic, then ones compliance to it is truly pathological; and being an instrument contributing to the body’s subjugation can hardly be described as science or medicine.
Simulation
I have used these words frequently in my blogs: “I have a functional prototype.” I have probably worn out the words due to overuse. Let’s return to Hans Selye’s argument that a “stress” is an internal response while a “stressor” is environmental. This distinction is exceptionally data relevant. Using my “functional prototype” – as I seem likely to say all too frequently – I make the data distinction between response and stimulus in a particular manner. There are data “events” (“stressors”); and there are data “features” (“stress”). In order to demonstrate the dynamics between events and features, I have a simulation to share. I had a program generate a random number from 0 to 19 in a trial of 500: for each trial, a file was generated containing the same random number both as the feature and also the event. If it helps, think of the random number as pounds of fruit. A grocer has a weighing device. If the scale shows 19, this is because there are 19 pounds of fruit on the scale. For a stress researcher, if blood pressure is shown as high, it is because blood pressure is being tested, and the blood pressure is high. I am not trying to restate the obvious. I have not yet separated event from feature. But I will – just as Selye did in relation to specimens – albeit for me more conceptually using data. The results of the simulation are shown below using a device called the Crosswave Differential Algorithm [4].
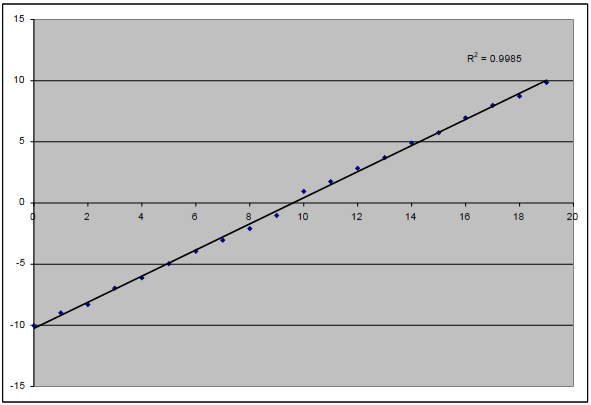
The algorithm is an interesting subject that deserves separate blogging; and indeed I have already posted a number of blogs more focused on the algorithm. The chart above shows that there are 20 events – from 0 to 19 – shown along the x-axis. There are also 20 features – from 0 to 19 – converted into crosswave differentials ranging from -10 to 10 along the y-axis. The events on the simulation happen to be the same as the features. This simulation is actually used for diagnostic purposes to ensure the algorithm is operating normally.
Imagine, instead of using events that match the features, the researcher invokes quotidian events. Rather than using blood pressure events with blood pressure readings, the researcher could make use of codified expressions of “everything” as events. The blood-pressure reading for a particular day might be associated for example with the following events: [attend.meeting] [eat.burger] [eat.fries] [take.elevator] [order.online] [visit.accounting] [visit.payroll] [investigate.workplaceinjury] [visit.restaurant] [submit.proposal]. There can be thousands of quotidian events linked to features by “mass data assignment”; this is yet another topic that I have covered in prior blogs. I hope readers are fairly clear on the distinction between events and features. Doctors appear to normally focus on features – that is to say, the outcomes of events. Consequently, given the absence of structural data, they might not have a strong sense of what events (stressors) brought about the features (stress). It can be tempting for some professionals to simply dismiss the events as non-substantive. I don’t believe that this phenomenon is unique to doctors. Not so much due to the absence of data but the absence of structural data to add shape to superficial metrics – the absence of methods to retain and handle structural data – all sorts of critical details might be declared discursive and immaterial.
Time Shifting Events and Features
One of the benefits of using a simulation – apart from confirming functionality – is gaining the ability to test theory. In a medical research setting, readings might be conflated and alienated from reality to the point of providing little real-life guidance; but perhaps the intent has never been to provide guidance. Some might argue that the true intent is to provide a pill to treat the symptom. Below is another illustration, using the same data as the previous image, except that it contains a “time shift.” If a person boards a plane one day, he or she might not reach Tahiti until the next day; yet boarding event indeed led to the Tahiti outcome. Instead of feature 15 relating to event 15 in the same trial period, event 15 is related to feature 15 in the next trial period. All of the data is desynchronized in this manner. Time shifting becomes possible only if events and features are detached from each other. In this scenario, the researcher must deliberately handle events as a separate concern. I realize that when a researcher is handling two data streams, there is the illusion of separation. I emphasize however how exceptionally different events can be from features. Features are handled as a thematic and contextual construct: these are highly structured. In contrast, events are freely circumstantial: these are potentially unstructured. For example, assume that a subway system generates millions of events expressible as tags. All of these tags can be assigned en masse to a metric for each day of service – perhaps into fare sales. In reality, there are likely timing differences between fare sales and fare use. A person might purchase 10 fares but use only 1 fare that day. Fare “use” is likely associated with all sorts of quotidian behaviours or events unrelated to fare sales.
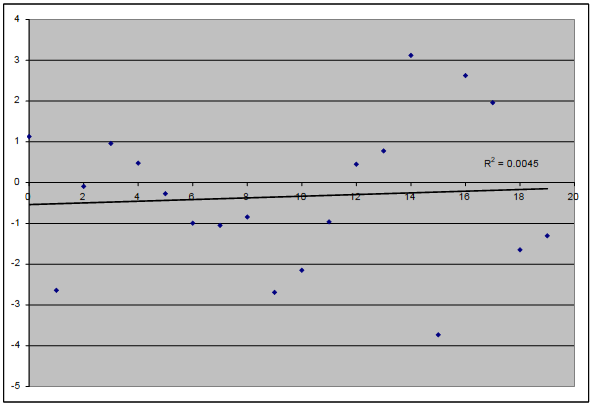
After the time shift shown above, there is essentially no correlation between events and features. The data is desynchronized and the simulation contains no convective kinetics. (The trial data from one session doesn’t flow into the next.) However, in real life, the temporal partitions aren’t nearly so clear. Time shifting matters in relation to various events and features. For example in a factory environment, from the time that an order is placed to when the finished goods are shipped, all sorts of interactions are probably most apparent through an analysis that incorporates time shifting. In a factory, embodiment lacks a physical shape and singularity of being. Yet management is generally aware of what is supposed to happen to an order and how it should interact with capital resources. In effect, there are elements of tangibility in the deployment of an order such as personnel and raw materials; and similar to a physical body, there is a limit to how much pathology can be investigated through superficial examination of this embodiment as an organizational construct, as if the broader operational setting doesn’t matter.
Real-life Data
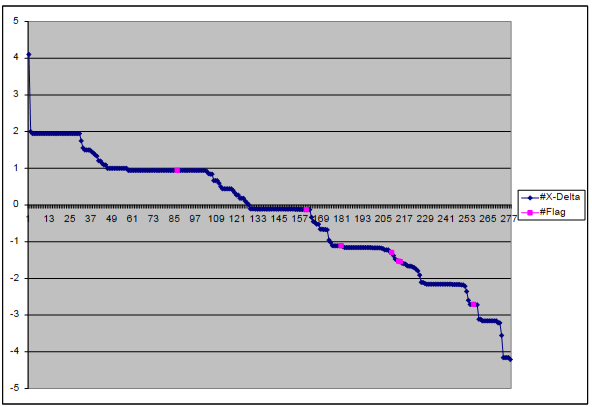
I hope readers find the next illustration interesting. It is not from a simulation. It is based on real-life data. In purple are “instances of pork” in among all sorts of other events. I eat quite a bit of pork. Pork might include ham cold cuts, pork chops, processed products made from pork, and of course bacon. As in my previous blog, I constructed a theme from a number of features to create a “health concern” of interest to me. I found that for most meats except pork, the distribution of purple dots above the crosswave differential of 0 is relatively balanced with the number of purple dots below. But for pork, the purple dots are skewed below 0 as shown on the chart. Below 0, adverse impacts to the health metric are indicated. This might seem ominous, as if I should stop eating pork. Sure, as if! On closer examination, I found that the three lowest crosswave differentials are all bacon related. I am extremely fond of bacon. However, the story doesn’t end there.
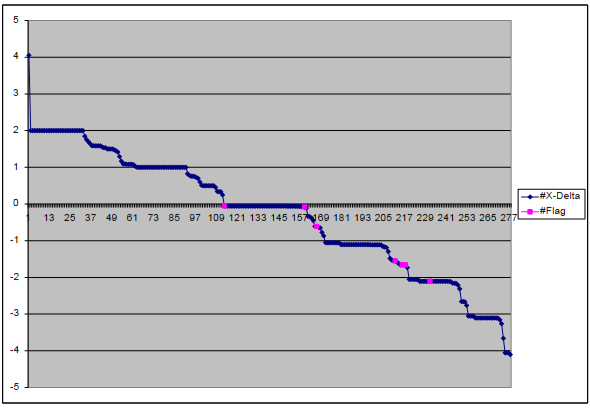
I found after time-shifting by 1 day – i.e. checking for the outcomes on each day “after” the consumption of pork – the purple dots remained concentrated at or below the crosswave differential of 0. The chart from the time shift is shown below. Based on these findings, what might the appropriate comment be in relation to me and pork? “Pork is bad for people.” No, I didn’t collect data in relation to people – only to me. “A person should eat lean pork.” This is not really based on data relevant to me. “Pork is generally bad for me.” Nope, I used a thematic construct rather than a metric relating to my general health. “If I want to improve the health metric in question, the algorithm seems to suggest that it would be reasonable to attempt to do so by eating less pork.” I think this final statement would be reasonable. If I reduce my pork consumption and the metric does not change, it would not be by doing anything “unreasonable.” The problem might not be pork consumption per se. If I try to compensate for the absence of pork flavour by eating other meats containing the same ingredients, there might be no improvement to the metric. I find that I am fairly drawn to smoked meats and flavours. I culprit might be in the smoke. I would have to investigate further.
An approach that I would agree seems scientific would be to systematically test for the body’s response to differential potential allergens; this after all involves the collection of real data. As I mentioned earlier, I am not trying to diminish the medical profession. However, apart from the cost to the health-care system of having a system of general practitioners and specialists investigating dietary peculiarities of individuals, I think that it would be fair to note the invasive nature of professional attention. It would be necessary for a client to take time off work; visit possibly a number of doctors in their offices and labs; return for follow-ups and continued monitoring. Yet is the problem necessarily “medical”? Can it possibly be “environmentally interactive” – relating to choices, preferences, and circumstances? The body is certainly involved. Because the metrics are of the body, it almost seems like the body is the only thing involved. The problem might actually be in the toxic environment or one’s interactions with a particular environment, gaining expression as disease in the body. Lung cancer might not be due to a genetic design flaw. It could be related to smoking cigarettes or inhaling asbestos. Diabetes might not be mere happenstance most evident among particular racial groups. It might be related to health determinants in the environment.
Environmentalism as Precursor to True Big Data
The example I gave earlier about a medical doctor hardly having much data is meant to show the role of data in many control settings. When a student is given an exam, and that exam is used to determine academic placement, the main role of the data gathered from the exam is to determine placement. I suggest that the role of data in relation to a general practitioner is to determine treatment – not necessarily to cure disease but literally to determine an institutionally mandated course of action. The practitioner whose main task is to determine treatment from superficial observations and readings might at some point be replaced by a nurse, medical administrator, or even an interactive medical database. Data is sometimes meant to “manage” a problem – almost in a business sense. I have observed that little data seems to be necessary to support the management of problems. If the objective is even narrower – say to manage the impacts of a problem to a particular body through the use specific pharmaceutical products – perhaps even less data is needed. Consequently, the use of data to manage the body’s response to a problem might involve little data.
If on the other hand the data is meant to manage the environment – to address problems in the environment – the challenge becomes more complicated. Not only are there more elements to take into account, but the environment is in motion; things within it or part of it are constantly changing. Personally I notice some conceptual similarities between my algorithm and ANOVA. Based on an explanation of ANOVA on the internet involving dogs [5], perhaps the weight of a dog can be considered in relation to colour such red dogs (treated) and non-red dogs (non-treated); hairiness such as hairy dogs (treated) and short-haired dogs (non-treated); and noisiness such as barking dogs (treated) and quiet dogs (non-treated). Dog characteristics are of the body. It is perfectly fine to consider weight in relation to the body. Then if one wished to have a scrawny dog, it would be an issue of maybe obtaining a dog having the appropriate characteristics. Why not simply get a scrawny dog, I wonder? The rest of the analysis seems superfluous. Well, the idea is to predict the weight of the dog based on the characteristics. In real life, there is this concept of promoting weight loss by encouraging certain dog behaviours such as fetching the stick. And where might a dog fetch a stick – in an apartment? No, it would probably be in a park. The owners would have to walk to the park with the dog to throw the stick. So there is a huge dimension of environmental interaction likely involved in setting the weight of dogs.
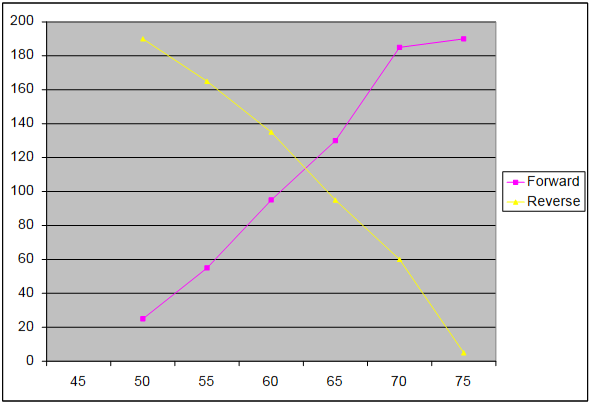
The difference between a crosswave and an average can be examined in relation to weight: assume that 25 dogs are found to be 50 pounds; 30 dogs 55 pounds; 40 dogs 60 pounds; 35 dogs 65 pounds; 55 dogs 70 pounds; and 5 dogs 75 pounds. What is the average weight of a dog? I’ll just check Excel since I can’t do this in my head. Over 190 dogs, that is 62.11 pounds per dog. On the other hand, using the crosswave, I would normally solve for the wave intercept (see below). But I can see the crossing occurs between 60 and 65 pounds – I suggest roughly around 62.5 pounds. This part of the process is therefore similar to dealing with means. A crosswave differential deals with the difference between two crosswaves (between treated and untreated). However, the crosswave doesn’t have to deal with quantitative measurements such as pounds. The crux of the difference might be described as follows: Let’s say – being quite ridiculous but conceptually decisive – I had a database of stock-market closing prices, product pricing data from a number of retailers, and the data pertaining to meals ordered from a local restaurant. I find that a dog weighs 50 pounds. I can assign all of that data to 50 pounds. Let’s say I didn’t do this deliberately. I just couldn’t be bothered separating the good data from irrelevant data. Perhaps I have no idea with good or irrelevant data is in relation to weight. If I then examine the event distribution over the weights, wouldn’t I know the environmental circumstances apparently associated with the weights?
Was that a bad example? All right, so let’s consider terrorist attacks. There might be a massive amount of data where it is quite difficult if not impossible to rationalize the connections “a priori.” To me, a traditional statistical approach just doesn’t seem robust enough for environmental applications where the researcher does not understand the nature of the data all that well; where there aren’t really any controls; where there isn’t much time for careful thought. Still, I’m not a statistician; so perhaps others have a stronger familiarity of how statistics can be used to deal with terrorism. My emphasis is on the environment and of the inner-person. Notice that my algorithm can actually operate in a fully qualitative setting: <IED> <ComFailure> <CodeWhiteShooter> can be associated with [BlueTie] [RiceShipment] [BarkingDog] [FullMoon] [CheckpointAlert]. Consider the discursive potential of my approach, allowing the environment to shape the events; allowing the person to shape the story.
By the Way
I am preparing an offline service that allows the public to submit data for conversion using the Crosswave Differential Algorithm [6]. The output will be in CSV format, allowing users to generate charts similar to those shown here. I am making this bulk data conversion service available to users willing to collect and submit data in a particular format: the “Trust Unnecessary File Format” or TUFF [7]. I am not accepting any health-related data. At some point, I will be releasing a compatible data-entry system as open-source. However, I don’t intend to ever release the code that I use to process the bulk data. I am not just a proponent of the algorithm. I also consider myself the person most responsible for regulating its use. Depending on the sort of feedback I receive, I might prohibit its use in certain jurisdictions, by specific agencies, and for particular applications. The algorithm may not be used for intelligence, military, or paramilitary applications – since restrictions might be imposed on its use. Nor may the algorithm be used by the civil service – since I consider the public service a competitor.
Returning to the Toxic Environment
Recall that the algorithm is designed to associate features (resulting outcomes or metrics) with events. If features pertain to the body as I have argued – the body often being focus of medical professionals – it can be argued that events relate to the interactions of the body with the surrounding environment. This distinction is only possible if we accept that there is indeed a split relationship. Accepting that features and events are split, it is possible to assert that the manifestation of disease might be externally conceived. Death therefore can be the result of toxicity – a toxic environment. I remember during an environmental toxicology class helping my lab partners squeeze a fish. The objective was to get a blood sample for analysis. The fact that a fish’s blood sample contains trace chemicals possibly indicating elevated toxicity doesn’t negate the fact that the toxicity is likely related to fish’s habitat. Similarly, Legionnaire’s Disease at a senior’s residence doesn’t just emerge spontaneously in the bodies of residents; such an outbreak might be related to the cooling system if contamination has occurred due to lack of proper maintenance. Thus, in order to determine the “cause” of diseases to the body, an over-emphasis on the body might conceal the truth and perpetuate the cause of disease.
While doctors focus on the body, I take into account the interactions of the body in relation to the environment. An assumption that I made sometime ago is that our human environment is becoming increasingly hostile. I am not necessarily making an absolute statement. I will express it differently. People are becoming increasingly powerless; they are losing the ability to exercise discretionary control. Consequently, the environment is becoming more hostile. There have been studies on people who continued performing their work duties despite long-term harm or damage to the body [8]. Perhaps due to economic circumstances or the nature of global competition, I suspect that are fewer opportunities for “flight.” There are fewer places to flee. People must therefore remain and “fight.” I would argue that the only real option for an increasing number of people is to endure and struggle. On one level there is the medical approach of dealing with the tormented body – and of course the heat-oppressed mind that lives within it. I focus on interaction – the paths people. I study two types of paths: the quotidian paths that reoccur – the subject of this blog; and emergent paths that generally do not reoccur, made easier to study through codified narrative. Medical professionals can probably discuss the metrics of disease pertaining to the body and the schema of pathology aligned with these metrics. However, the metrics represent only one side of the data puzzle.
[1] Richard S. Lazarus and Susan Folkman, Stress, Appraisal, and Coping (New York, NY: Springer Publishing Company, Inc., 1984), 2.
[2] Shirley Reynolds and David A. Shapiro, “Stress Reduction in Transition: Conceptual Problems in the Design, Implementation, and Evaluation of Worksite Stress Management Interventions,” Human Relations 44, no. 7 (1991): 721.
[3] Robert A. Karasek, R. Scott Russell, and Töres Theorell, “Physiology of Stress and Regeneration in Job Related Cardiovascular Illness,” Journal of Human Stress 8, no. 1 (1982): 35.
[4] Read more at http://www.datasciencecentral.com/profiles/blogs/deconstructing-sym…; and also http://www.datasciencecentral.com/profiles/blogs/mass-data-simulations.
[5] Refer to https://en.wikipedia.org/wiki/Analysis_of_variance.
[6] The website remains under construction at http://www.syscatch.com. I am trying to decide whether to use the online rendering tools or if I should FTP the pages.
[7] Some details can be found at http://www.datasciencecentral.com/profiles/blogs/deconstructing-sym….
[8] Chantal Brisson, Michel Vezina, and Alain Vinet, “Health Problems of Women Employed in Jobs Involving Psychological and Ergonomic Stressors,” Women & Health 18, no. 3 (1992): 63.