
by Mike Thurber and John Elder, Ph.D.

By tracking anonymized mobile phone location data and COVID-19 case reports for many countries with different policies, we studied the effect of restricting mobility on the spread of COVID-19. We found that lockdown policies did rapidly reduce the Covid reproduction ratio, R, but only up until ~3 days before a country’s peak daily case rate, and they had little or negative impact after that. Also, people should be allowed to go to Parks.
Motivation
Public health steps to mitigate the spread of COVID-19 include testing, contact tracing, wearing masks, increasing personal spacing, and heightened cleaning. But the most consequential has been emergency mobility restrictions. Those have come with unparalleled economic costs in terms of lost jobs and trillions of dollars of economic output. Are the public health benefits of extended restrictions worth the cost? We aim to quantify what is gained by a country’s policies through comparison with its peers.
Findings
We used phone mobility data to measure the severity of lockdown restrictions on a daily basis, and COVID-19 case reporting to calculate R, the rate of spread of the virus. We found that:
- The rate of spread of the disease was rapidly reduced early in the outbreak up until about 3 days before the peak daily case rate.
- Thereafter, mobility restrictions caused no further reductions in the spread of the disease.
- Restricting travel to “Parks” locations was least helpful early, and of no help later.
Analysis
Relative mobility data and daily COVID case rates were compiled by country and calendar day. To quantify the disease spread, R was estimated by day for each country (as detailed in the Methods section below). R is the reproduction ratio, or number of infections caused per case.
We wanted to know: What is the impact of reduced mobility on disease spread? To get there, we represented each country as a point in a two-dimensional space {mobility, R}, by day. Once we lined up the days so countries are in comparable stages of the outbreak, we could calculate the correlation between those two variables among the countries (as shown below in Figures 2 and 3). To account for the different dates the disease hit each country, we called a country’s peak infection date “day 0” (defined as when R started to go below 1.0, according to a 7-day moving average of the case reports). We calculated correlations of {mobility, R} from day -21 before the peak through day 7 after the peak. We found it most illuminating to separate mobility data into five different types of destinations: {Work, Parks, Transit, Retail & Recreation, Grocery & Pharmacy}.
The countries we could employ needed to have mobility data up to April 21, 2020. We also required they have > 2,000 cumulative COVID-19 cases. (Most resulting data points in Figure 1 contain information from 30 countries, but since the peak date varies by country and the R estimates require 11 days of subsequent data, the number of countries represented by each data point decreases gradually from 30 to 14 between days -3 to 7.)
The y-axis of Figure 1 shows the relationship between mobility levels and R. Note that, when separating mobility information into five types of destinations, Parks behave least like the others. Where the graph is positive it means mobility and R are correlated; that is, that countries that restrict movement are reducing disease reproduction. Early in an outbreak, restrictions on mobility are very effective, though much less so on travel to Parks. But effects drop into negative territory before the peak “day 0”, suggesting that, on balance, lockdowns may actually become slightly harmful as countries recover from the pandemic. This result amplifies the findings of Agarwal and his MIT team who also studied location data and found that “lifting severe mobility restrictions and only retaining moderate mobility restrictions (at retail and transit locations), seems to effectively flatten the curve.”
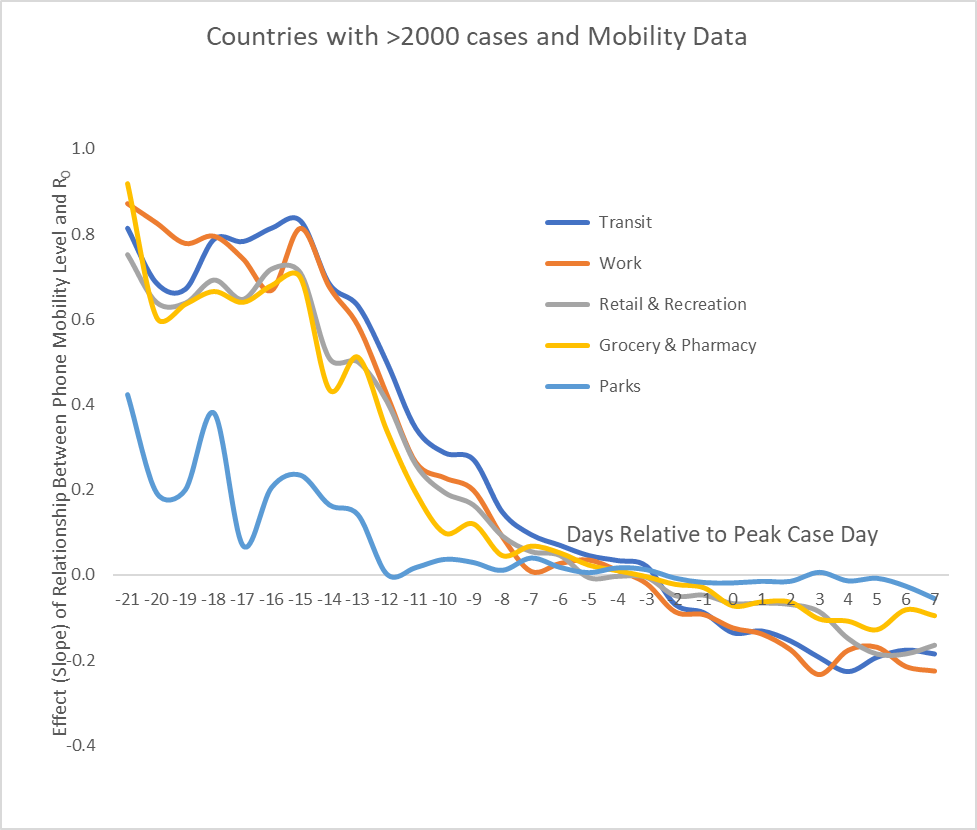
Figure 1: The changing benefit of mobility restrictions on the spread of COVID-19 vs. day, where day 0 is peak case day. Early effects are strong (except for travel to Parks), drop off two weeks before the peak,
die down to zero ~3 days before peak, then drift below zero.
Note that Figure 1 represents a relationship over time in a cross-section of countries; it should not be interpreted as what happens to any single country over time. To clarify what is plotted in Figure 1, let’s focus on just one metric, mobility to Retail & Recreational venues, and just one day, the 15th day prior to the peak. Figure 2 plots mobility reduction against R across the countries (for their day -15), and the fitted line has a linear regression slope of 0.71. A positive slope means that the more mobility to Retail & Recreational facilities the set of countries has the greater is R, the reproduction ratio of COVID-19. Here, roughly two weeks before peak, lockdowns are having a strong effect; for example, a country that reduces mobility to Retail & Recreational facilities by 50% can expect to reduce R by .355 (0.71*0.50
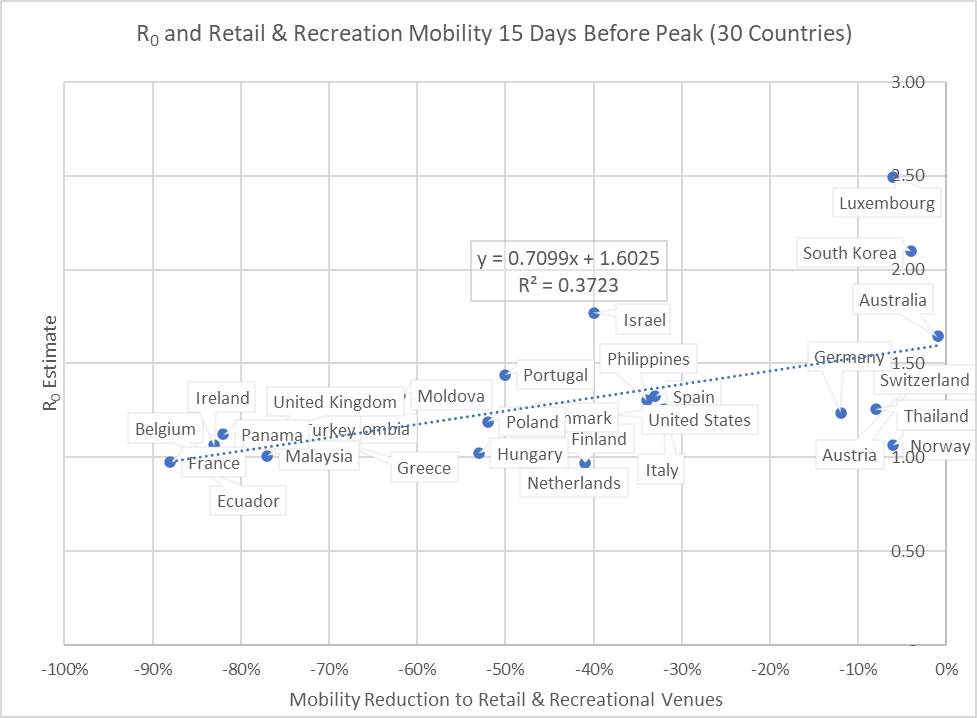
Figure 2: Relationship between R and mobility to Retail & Recreational venues 15 days prior to peak (slope is 0.71)
When we plot this for the peak day (Figure 3), we see that the correlation has faded; that is, the slope of the relationship has drifted below zero. Note that the slopes from Figures 2 and 3 each become a data point of the grey Retail & Recreation line in Figure 1.
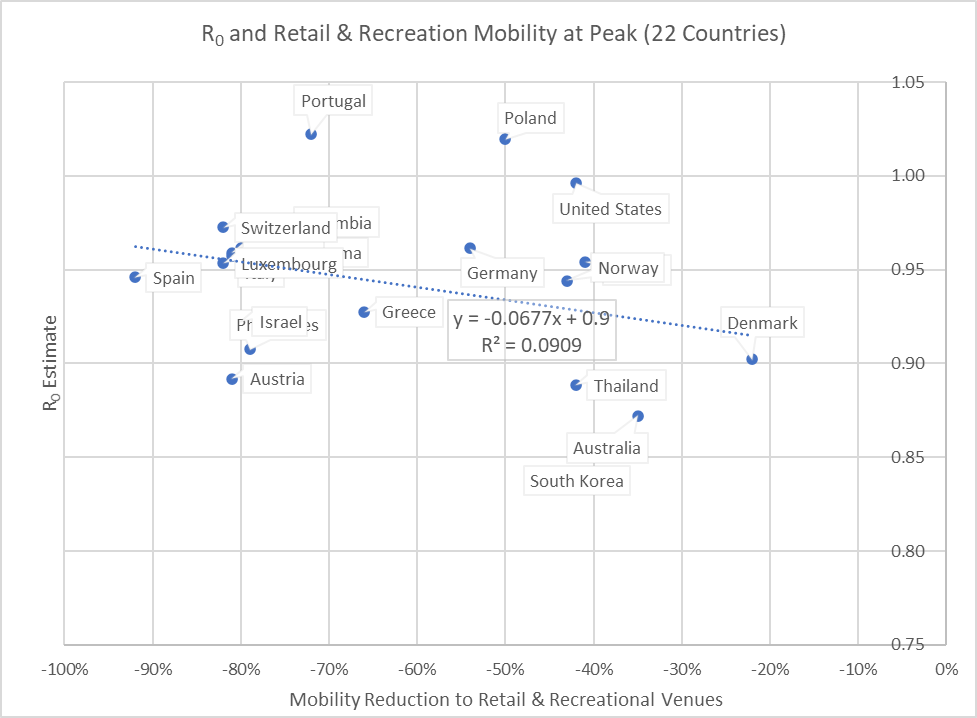
Figure 3: Relationship at peak day between R and mobility to Retail & Recreational venues.(The slope is insignificant at -0.07. Note the y-scale is different from that of Figure 2.)
Discussion
We see that reducing mobility slowed the spread of the disease in the early stages when the daily number of cases of COVID-19 were growing. This is concrete evidence that early efforts to “flatten the curve”, to avoid overwhelming hospitals and healthcare workers, was very helpful. But the later days of Figure 1 show that extended lockdown policies did not further reduce R — at which point, arguably, its public health effects (both Covid and non-Covid) predominately become harmful.
Interestingly, one travel venue stands out; reducing visits to Parks is least helpful initially and quickly becomes useless. (Perhaps UV sunlight kills the virus or enhances immunity, or households that go outside reduce opportunities for the disease to spread among themselves?) And, greater mobility to other venues, notably including Work, has a mild post-peak effect of reducing the spread of COVID-19. Although the reasons need to be explored, the evidence from this study encourages allowing freer movement earlier — around the time of peak cases — and monitoring the effects of this policy. It may be that at later stages of a shutdown mobility actually drives R down and can end pandemic health effects more quickly, as well as dramatically reduce the economic damage.
Naturally, cautions remain. The vulnerable need to be protected. Targeted and voluntary isolation should be supported until the disease is gone. Testing needs to be widespread so that hot spots can be identified and controlled. But allowing the less vulnerable to move more freely (while avoiding contact with the vulnerable) should speed the reduction in R. The faster R goes down the faster the infection will die off and not be a threat. This study indicates that intelligently relaxing mobility restrictions should facilitate this goal.
Addendum
Sources, and Method for Estimating R:
- More about phone mobility data here
- List of case report sources here
- How we estimated R is explained below.
R varies as the number of encounters with an infectious individual changes and with how many of those encountered are susceptible. The public health objective is to reduce R by reducing encounters with susceptible individuals. When R falls below 1, the disease begins to die out. R drops as people become un-susceptible (immune) by recovering from the disease, overcoming it asymptomatically, or (someday) through a vaccine.
To estimate R at a given point in time, we need to know the number of people who were infectious at some prior point, and the number of people they infected. These numbers are not reported explicitly, but we can arrive at estimates by working backwards from things that have been studied and published:
- The number of cases that are reported per day
- How long the virus must incubate before it becomes infectious
- How long the virus stays infectious
- How long, on average, it takes for infected cases to be reported
The number of infected divided by the number of infectious gives us a consistent estimate of R.
R can be calculated from the daily case reports given estimates of the incubation period, infectious period and lags in test reports. With these, we calculated a smoothed estimate of the number of infectious individuals on any given day and the number of individuals infected by them.
R = Infected / Infectious, as shown in Figure 4.
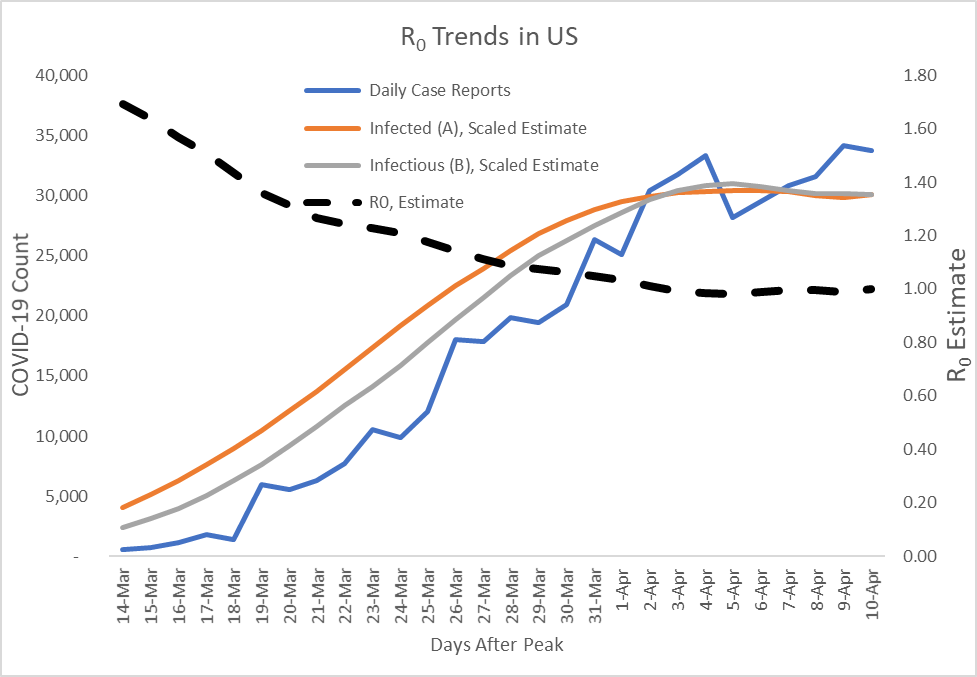
Figure 4: R Progression Estimates with its Numerator and Denominator
Acknowledgement
The authors thank colleague Peter Bruce for several rounds of helpful counsel in the analysis and interpretation of these results.
)