
 Kafka monitoring is an important and widespread operation which is used for the optimization of the Kafka deployment. This process may be smooth and efficient for you by applying one of the existing monitoring solutions instead of building your own. Let’s say, we use solution with Apache Kafka for message transfer and processing on our project cluster and we want to monitor it. Fortunately, Kafka developers give us such an opportunity. In this article we will give you some hints related to installation, setup and running of such monitoring solutions as Prometheus, Telegraf, and Grafana as well as their brief descriptions with examples. As a result, we’ll see the system, Kafka Broker, Kafka Consumer, and Kafka Producer metrics on our dashboard on Grafana side.
Installation and setup
Kafka and Prometheus JMX exporter
Kafka is an open-source stream-processing software platform written in Scala and Java. The general aim is to provide a unified, high-throughput, low-latency platform for real-time handling of data feeds. The storage layer of the software platform makes it extremely beneficial for businesses in terms of processing the streaming data. Moreover, Kafka is capable to connect to the external systems via Kafka Connect. Apache Kafka provides you with opportunities:
-
to subscribe to streams of records;
-
to publish data to any numbers of systems;
-
to store the streams of records;
-
to process the streams of records.
Prometheus JMX exporter is a collector, designed for scraping and exposing mBeans of a JMX target. It runs as a Java agent as well as an independent HTTP server. The JMX exporter can export from various applications and efficiently work with your matrix.
Installation
We’ll use Prometheus JMX exporter for scraping Kafka Broker, Kafka Consumer, and Kafka Producer metrics. Java and Zookeeper should be already installed and running.
- Download Kafka:
wget http://www-eu.apache.org/dist/kafka/1.1.0/kafka_2.11-1.1.0.tgz -P /tmp/
sudo tar -zxvf /tmp/kafka_2.11-1.1.0.tgz -C /opt/
sudo ln -s /opt/kafka_2.11-1.1.0 /opt/kafka sudo mkdir /opt/kafka/prometheus/
- Download Prometheus JMX exporter:
sudo wget -P /opt/kafka/prometheus/ https://repo1.maven.org/maven2/io/prometheus/
jmx/jmx_prometheus_javaagent/0.3.0/jmx_prometheus_javaagent-0.3.0.jar
sudo wget -P/opt/kafka/prometheus/https://raw.githubusercontent.com/prometheus/
jmx_exporter/master/example_configs/kafka-0-8-2.ym - Edit Prometheus JMX exporter config file. We’ll append it with Kafka Consumer and Kafka Producer scraping query:
- pattern : kafka.producer<type=producer-metrics, client-id=(.+)><>(.+):\w*
  name: kafka_producer_$
- pattern : kafka.consumer<type=consumer-metrics, client-id=(.+)><>(.+):\w*
name: kafka_consumer_$2- pattern : kafka.consumer<type=consumer-fetch-manager-metrics, client-id=(.+)><>(.+):\w*
name: kafka_consumer_$2
More accessible queries defined by Confluent here.
Run
Now, we are fully prepared to start Kafka’s services with Jolokia JVM agent. This material is just an example, so here we’ll run the console version of Kafka Consumer and Kafka Producer. But you can run Jolokia Agent with own consumer and producer based on JVM.
- Start Kafka Broker:
sudo KAFKA_HEAP_OPTS="-Xmx1000M -Xms1000M" KAFKA_OPTS="-javaagent:/opt/kafka/prometheus/jmx_prometheus_javaagent-0.3.0.jar=7071:/opt/kafka/
prometheus/kafka-0-8-2.yml"
/opt/kafka/bin/kafka-server-start.sh -daemon /opt/kafka/config/server.properties - Start Kafka Consumer:
KAFKA_OPTS="-javaagent:/opt/kafka/prometheus/jmx_prometheus_javaagent-0.3.0.jar=7072:/
opt/kafka/prometheus/kafka-0-8-2.yml"
/opt/kafka/bin/kafka-console-consumer.sh --bootstrap-server 0.0.0.0:9092 --topic test --from-beginning - Start Kafka Producer:
KAFKA_OPTS="-javaagent:/opt/kafka/prometheus/jmx_prometheus_javaagent-0.3.0.jar=7073:/
opt/kafka/prometheus/kafka-0-8-2.yml"
/opt/kafka/bin/kafka-console-producer.sh --broker-list 0.0.0.0:9092 --topic test
Prometheus
Prometheus is an open-source time series monitoring solution with pull-model collecting storage, flexible query language, and high-throughput availability. Prometheus has a simple and powerful model allowing to carry out analysis of infrastructure performance. Prometheus text format allows the system to focus on core features. Thus, Prometheus proves to be very performative, efficient and easy to run.
Installation
- Create Prometheus directories:
sudo mkdir /etc/prometheus /var/lib/prometheus /var/log/prometheus /var/run/prometheus
- Download and install Prometheus:
wget https://github.com/prometheus/prometheus/releases/download/v2.2.1/p... -P /tmp/

sudo tar -zxvf /tmp/prometheus-2.2.1.linux-amd64.tar.gz -C /tmp/
 sudo cp /tmp/prometheus-2.2.1.linux-amd64/{prometheus,promtool} /usr/local/bin/
 sudo chmod +x  /usr/local/bin/{prometheus,promtool}
 sudo cp  /tmp/prometheus-2.2.1.linux-amd64/prometheus.yml /etc/prometheus/
 sudo cp -r /tmp/prometheus-2.2.1.linux-amd64/{consoles,console_libraries} /etc/prometheus/
- Append /etc/prometheus/prometheus.yml for needed exporters:
 - job_name: 'kafka-server'
static_configs:
- targets: ['127.0.0.1:7071']
 - job_name: 'kafka-consumer'
static_configs:
- targets: ['127.0.0.1:7072']
 - job_name: 'kafka-producer'
static_configs:
- targets: ['127.0.0.1:7073']
 - job_name: 'telegraf'
static_configs:
- targets: ['127.0.0.1:9200'] - Prometheus systemd service (/etc/systemd/system/prometheus.service):
[Unit]

Description=Prometheus
 Wants=network-online.target
 After=network-online.target

 [Service]
 User=root
 Group=root
 Type=simple
 ExecStart=/usr/local/bin/prometheus \
         --config.file /etc/prometheus/prometheus.yml \
         --storage.tsdb.path /var/lib/prometheus/ \
         --web.console.templates=/etc/prometheus/consoles \
         --web.console.libraries=/etc/prometheus/console_libraries

 [Install]
 WantedBy=multi-user.target
- Start Prometheus:
sudo systemctl enable prometheus.service && sudo service prometheus start
Telegraf
Telegraf is a powerful open-source data collecting agent written in Go. It collects performance metrics of the system and services. Telegraf provides opportunity to monitor, process and push data to many different services. This agent has some beneficial peculiarities making it a good choice in terms of data collecting and reporting:
- minimal memory footprint;
- easy and fast addition of the new outputs;
- a wide number of plugins for various services.
Installation
- Add an Influx repo:
curl -sL https://repos.influxdata.com/influxdb.key | sudo apt-key add -
source /etc/lsb-release
echo "deb https://repos.influxdata.com/${DISTRIB_ID,,} ${DISTRIB_CODENAME} stable" |
sudo tee /etc/apt/sources.list.d/influxdb.list - Install Telegraf:
sudo apt-get update && sudo apt-get install telegraf
- Change config: comment out InfluxDB output, and then append outputs list with Prometheus exporter.
  listen = ":9200"
collectors_exclude = ["gocollector", "process"] - Run Telegraf:
sudo systemctl enable telegraf.service
sudo service telegraf start
Grafana
Grafana is a popular fully-featured open-source frontend dashboard solution. This is a visualization tool designed to work with a variety of data sources like Graphite, InfluxDB, Elasticsearch, etc. This solution allows the fast and easy development of dashboards for users. Key functional opportunities provided by Grafana are as follows:
- easy downloading and sharing smart dashboards;
- access to Grafana Cloud;
- use of diverse panels.
Installation
- Add Grafana repo:
curl https://packagecloud.io/gpg.key | sudo apt-key add -
source /etc/lsb-release
echo "deb https://packagecloud.io/grafana/stable/debian/ stretch main" |
sudo tee /etc/apt/sources.list.d/grafana.list - Install Grafana:
sudo apt-get update && sudo apt-get install grafana
- Run Grafana:
sudo systemctl enable grafana-server.servicesudo service grafana-server start
View metrics
Now, we’ll see metrics on Prometheus side and also prepare Grafana Dashboard.
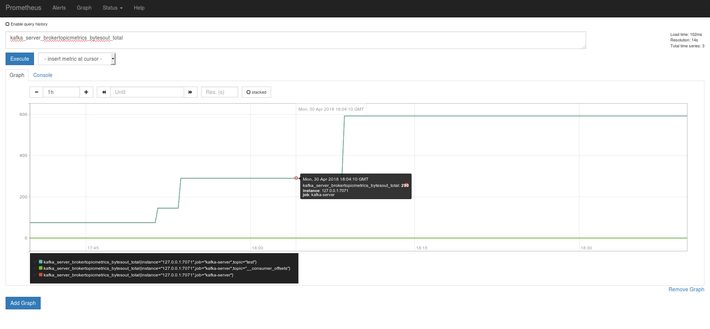
Prometheus
Open http://localhost:9090/graph and start to explore with “kafka” prefix.
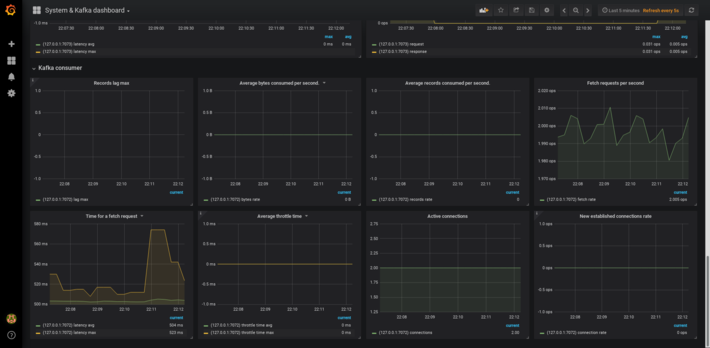
Grafana
Here’s the example dashboard for the system and Kafka monitoring:
Conclusion
In this article we attempted to compile short and comprehensive guide on the installation, setup and running of such monitoring solutions as Prometheus, Telegraf, and Grafana. These solutions prove to be very efficient in collecting metrics, preventing problems and keeping you alert in case of emergencies.