
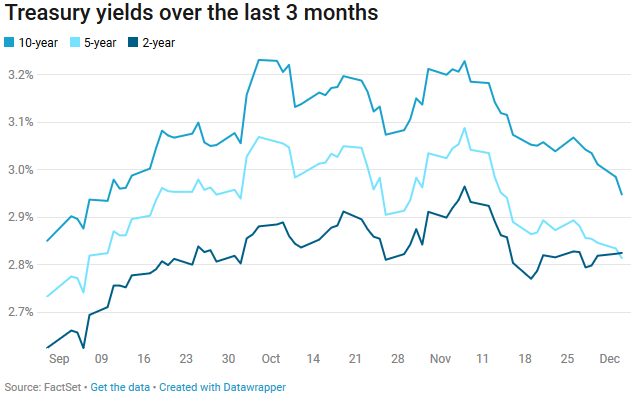
On 3 Dec 2018 when the US treasury yield curves inverted (a short-term US government bond yield is higher than its long-term yield), Economists quickly warned the stock market of an impending economic slowdown or even a recession. The following graph illustrates the inversion of US treasury yield curve on Monday, 3 Dec 2018 (see the crossing of 2-year over the 5-year on December the 3rd), which was followed by a nearly 800-point plunge for Dow the next day. (Interestingly, one example used in our research paper studying CDS curve inversion was from 3 December 2008, exactly 10 years ago; what a coincidence!)
 Yield curve inversion is well-studied and paid a lot of attention to; however, the shapes of individual curves for Credit Default Swap (or CDS, which is an insurance premium sold in the CDS market for protecting default of an entity, such as a corporate or a government.) is much less studied and only limited amount of attention is paid to it. Importantly, the exact mathematical conditions governing the shape of a CDS curve is not rigorously established and no systematic research has been conducted to investigate what happened during and after the 2007-09 financial crisis to the shapes of CDS curves, how significant the inversions of CDS curves as well as resultant arbitrage opportunities were as well as what the implications are on OTC derivatives pricing theory and practices.
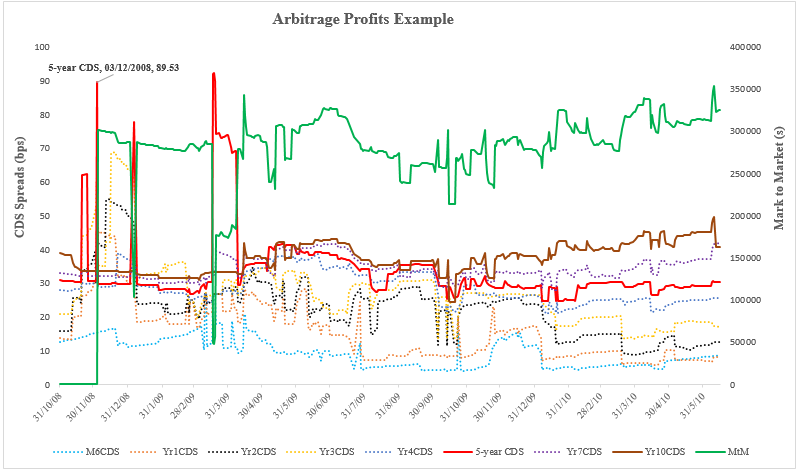
After a year of intensive research, the paper by Brummelhuis and Luo (2018) titled Arbitrage Opportunities in CDS term structure: Theory and Implicati… presents a summary of such an investigation based on 30+ million pairs of CDS trades to fill in the research gaps mentioned above. The paper derived the exact mathematical conditions governing the shape of a CDS curve in order to disallow arbitrage (CDS curve inversion is one of such conditions.), which leads to the findings of a large number of so-called arbitrage opportunities in CDS term structure, which turn out to lead to persistent arbitrage profits as illustrated below.
When the 5-year CDS rate (highlighted in red) crossed into 10-year CDS rate (highlighted in brown), an inversion of CDS curve happened. In the example below, when inversion happened first on 3 December 2008 (exactly 10-year ago!), within zero initial costs, if one sells default protection at 5-year CDS rate (89.53 basis point) and buy default protection at much lower 10-year CDS rate, one should expect persistent arbitrage profits represented by the green line. The calculation is based on standard CDS model used by banks. See the paper for more details.
This concludes the summary regarding what motivates the research done in the paper #3 from the following four papers; please feel free to check out other papers below if interested. We welcome you to read and provide feedback for our research; if possible, please feel free to reference to our papers.
- CDS Rate Construction Methods by Machine Learning Techniques: Methodology and Results; Brummelhuis and Luo, forthcoming in peer-reviewed journal, 2018a
- CDS Rate Construction Methods by Machine Learning Techniques: Parameterization, Correlation and Benchmarking; Brummelhuis and Luo, forthcoming in peer-reviewed journal, 2018b
- Arbitrage Opportunities in CDS Term Structure: Theory and Implications on OTC Derivatives. Brummelhuis and Luo, SSRN journal, 2018c
- Bank Net Interest Margin Forecasting and Capital Stress Testing by Machine Learning Techniques. Brummelhuis and Luo, SSRN journal, 2018d (will be available soon)