
Hello Everyone, I’ve just recently joined this site. Firstly, I would like to share with you all a free and open-sourced tool that I have published on github.com for Tableau that reduces the time required to complete a report. It takes the stress out of remembering what calculated fields are used and where across your workbook by giving you an easy to browse Tableau report that can be refreshed anytime you save your work. Find it here! https://github.com/mcdean/BiToolMetaBrowser
Please feel free to leave any feedback.
And, I look forward to learning more data science from this community in hopes of applying it to solve problems and to potentially make more contributions to the collection of available software tools.
Thank you.
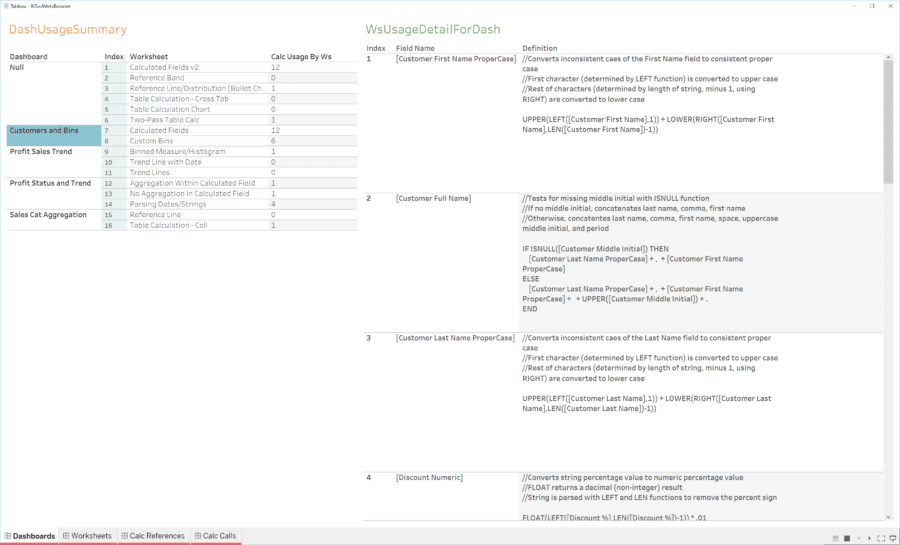
BI Tool Meta Browser (BMB) is a tool for examining the calculated field usage and dependencies of a Tableau workbook. Similar to how MS Visual Studio or other IDE’s allow you to navigate the dependency tree of classes and methods or perform a find all references, BMB provides a Tableau-centric view of your own Tableau workbook which includes a handful of dashboards that present the same sort of information.
Rationale
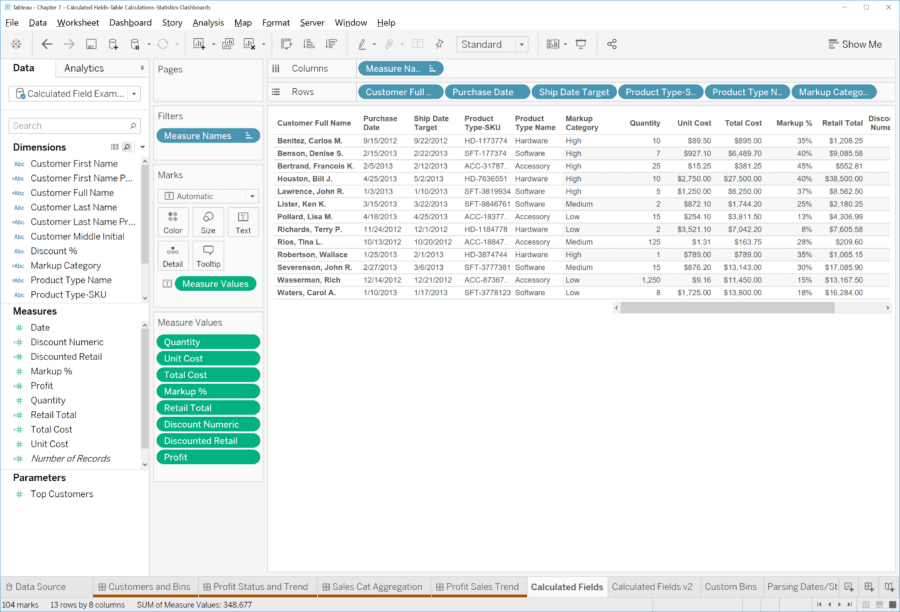
Tableau is a superior BI tool for analyzing and visualizing data. It makes it possible to program vast amounts of query logic in the form of calculated fields along-side a visual design surface. These fields can be used inside other fields or can be placed on different sheets. The sheets can then be combined inside dashboards. While these are great report authoring capabilities, Tableau does not provide an efficient way to examine the field definitions or where they are used across areas of the Tableau report or workbook.
Example Calculated Field
For example, the Total Cost calculated field is show below. This can be found in a workbook called Calculated Fields-Table Calculations-Statistics.twbx hosted on the following website: http://www.tableaubook.com/v8/workbooks.asp An alternate version of this workbook with a number of dashboards added is used throughout this wiki. The combination of sheets added to the dashboards is not particularly important, but serves as a decent example for the BMB tool.
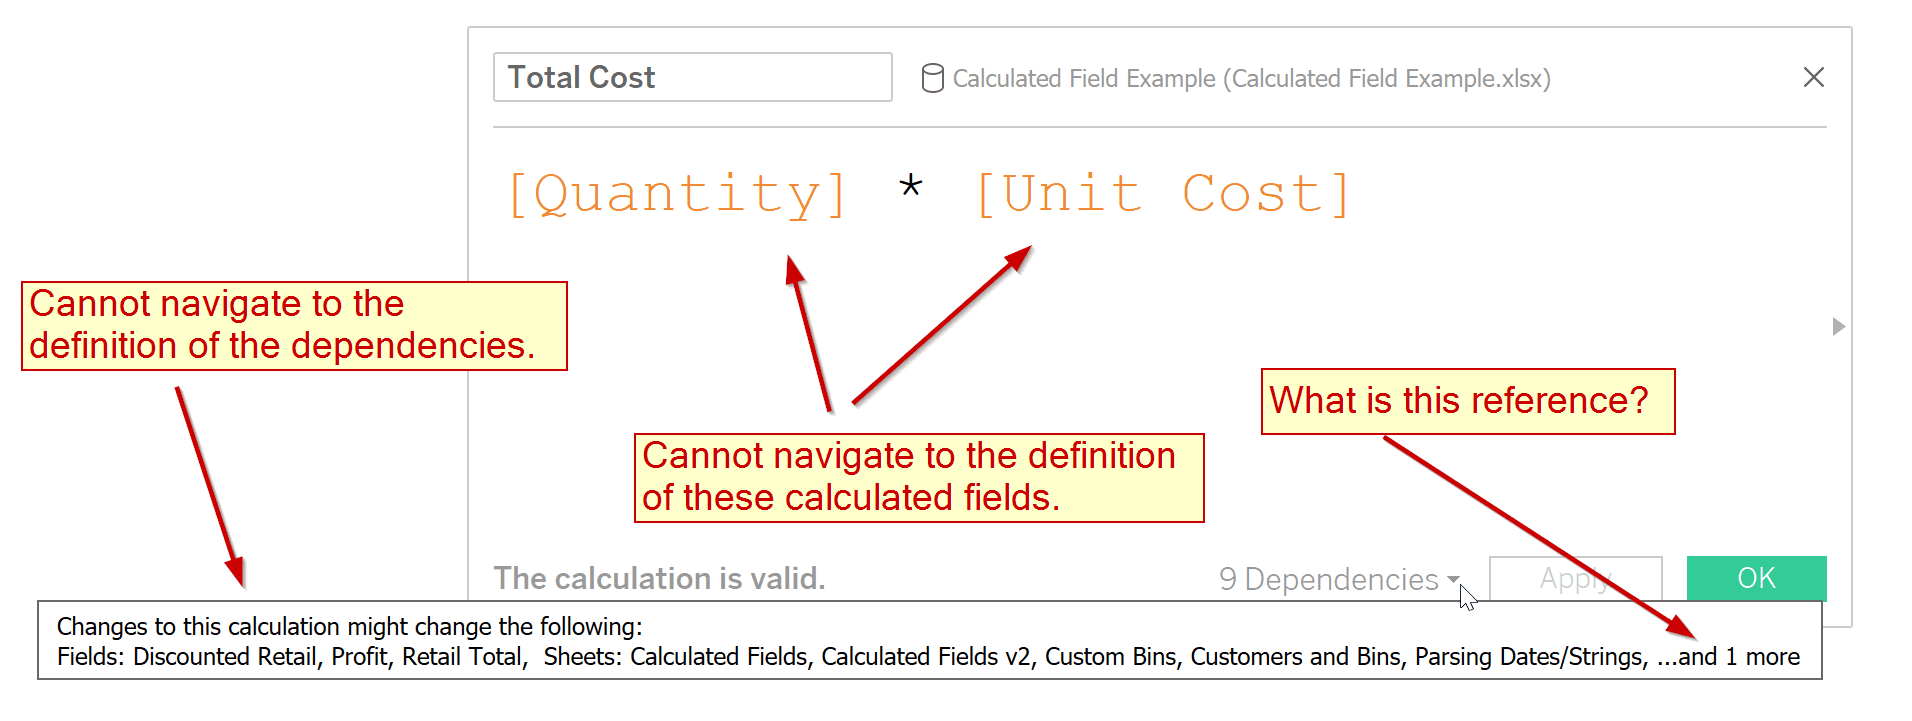
Notice that there are nine dependencies and they are not even all listed in the tool-tip pop-up. It says “… and 1 more”, instead. Also, the ones shown are not actually click-able. Nor, can the user navigate to the definition of the Quantity or Unit Cost calculated fields which are used in the definition of the Total Cost field from within this window.
The full list of calculated fields can be found, of course, on the left-side pane of the user interface. Nonetheless, it is tedious and painful to click through each one to understand the full picture of calculated field usage and their definitions. Furthermore, Tableau only allows one field definition to be opened at a time.
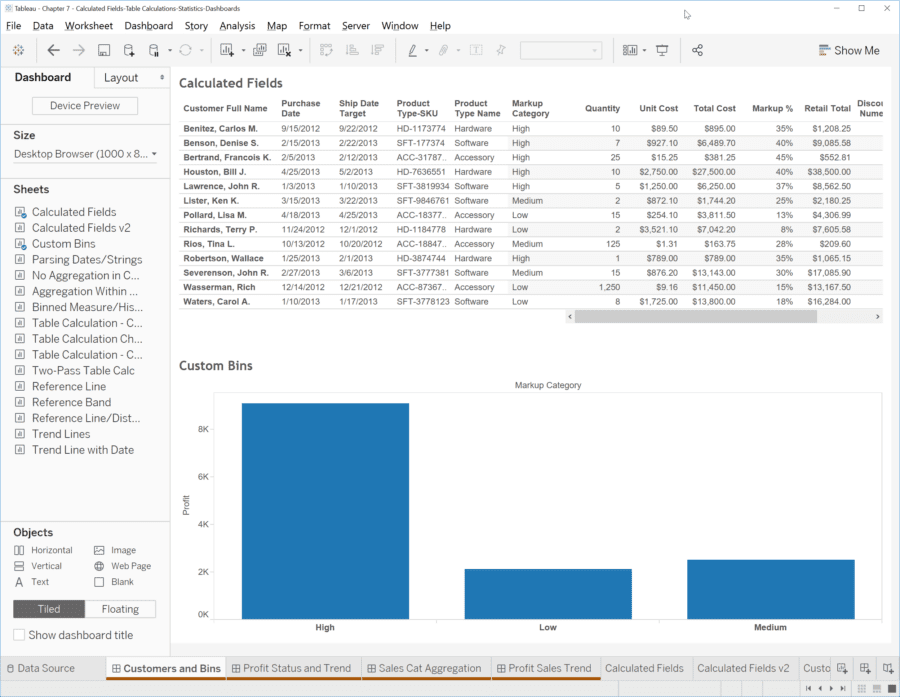
Here is an additional view of the workbook. Many sheets are set to hidden, and one of the dashboards is showing–hiding all sheets is a common setting to use. In this case, Tableau does not show the calculated field list at all.