
In this article was written by Michael Grogan. Michael is a data scientist and statistician, with a profound passion for statistics and programming.
In a previous tutorial, I elaborated on how an ARIMA model can be implemented using R. The model was fitted on a stock price dataset, with a (0,1,0) configuration being used for ARIMA.
Here, I detail how to implement an ARIMA model in Python using the pandas and statsmodels libraries. I cover most of the theoretical “need-to-knows” in my previous article – this post is mainly to demonstrate how the same can be implemented in Python.
1. Load Libraries
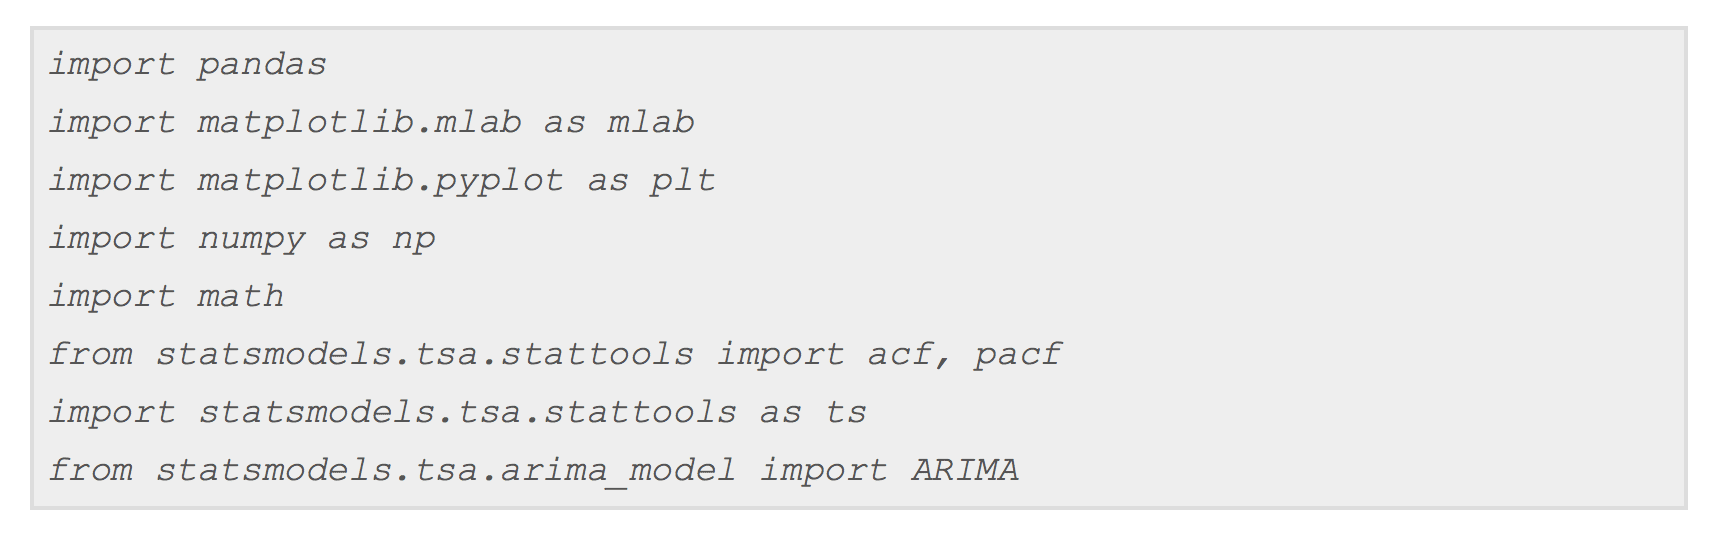
Firstly, we load our libraries as standard. The library of major importance in this case is statsmodels, since we are using this library to calculate the ACF and PACF statistics, and also to formulate the ARIMA model:
2. Import csv and define “price” variable using pandas

In the full article you will find:
3. Autocorrelation and Partial Autocorrelation Plots
4. ARIMA Model Generation
To read more, click here.
DSC Resources
- Services: Hire a Data Scientist | Search DSC | Classifieds | Find a Job
- Contributors: Post a Blog | Ask a Question
- Follow us: @DataScienceCtrl | @AnalyticBridge
Popular Articles
)