
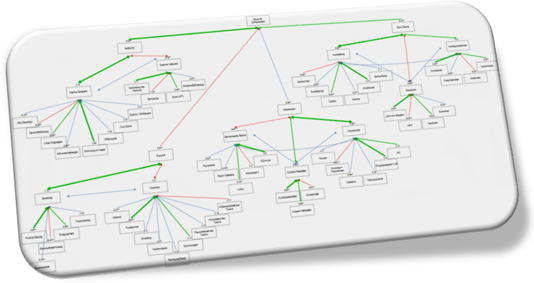
Image A: Customer Satisfaction Tree – Courtesy of MarketingStat Satisfaction Modeler©
Interest in the concept of measuring customer satisfaction is growing. More and more companies want to know how satisfied their customers are. At the same time an increasing number of decision-makers are realizing that measuring overall satisfaction alone isn’t enough. They want to know how much overall satisfaction increases when the satisfaction with a given attribute grows. Only then is it possible to make plans that deliver what they promise. This article sheds light on how to create a valid customer satisfaction measurement model that can measure the contribution of a single attribute to overall satisfaction.
Customer satisfaction studies often begin this way
Say your boss asks you to measure your clients’ satisfaction. You are not an expert on the subject, so you speak to a traditional market research agency. They ask for $15,000. You agree and together you make a list of attributes touching different aspects of the client-company relationship. The agency formalizes the questionnaire. You approve it. The survey runs, and at the end you receive the results in the form of a Customer Satisfaction Index (CSI), or Customer Satisfaction Score (CSAT), or Customer Effort Score (CES), or Net Promoter Score (NPS®), or some other index. The score is high. Your boss is happy. You’re all done.
A week later a colleague with a statistical background comes to you and says “I’m afraid we are spending too much money for the customer satisfaction survey and, even worse, the survey results are not valid”.
You think this is a paradox? Not really, and it may well apply to your case. Read further; I am going to tell you how to fix it.
How to spot a wrong customer satisfaction measurement
When measuring customer satisfaction, we are assuming “The satisfaction (S) of our customers depends on these attributes (ai): {list of attributes}”. In mathematical terms we speak of a function, such as: ![]()
There are a few questions though:
- Are all attributes relevant and necessary?
- How do we know these attributes measure satisfaction in a reliable way?
- Can we estimate how much each attribute contributes to overall customer satisfaction?
If we cannot answer these questions without beginning the sentence with “I think that …” odds are we have a faulty model. We are not measuring customer satisfaction or, in the best case, we are gathering unreliable customer opinions, which may mean wrong results.
A real example of customer satisfaction measurement
Some time ago a multinational company decided to measure their customer satisfaction. The management defined a model made of five main areas: Sales, Products, R&D, Back office, Communication. For the sake of simplicity we’ll just discuss the sub-model Sales.
The company management assigned a qualitative study to a traditional market research agency. They interviewed customers in focus groups and one-on-one interviews, and made a list of topics that emerged during the study. The management decided that the satisfaction of customers relating to interaction with sales activities was influenced by the 23 attributes pictured in image 1. 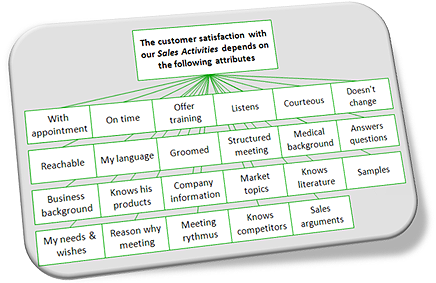
Image 1: Attributes influencing customer satisfaction relating to the company’s Sales activities.
The same agency was assigned the quantitative measurement of customer satisfaction. They assembled the questionnaire, and gathered the first wave of interviews. The research was easy. They asked for “overall satisfaction” with the company’s sales representatives, and then the question was always the same: “How satisfied are you with respect to …” and each attribute followed, for instance “…the sales rep makes an appointment with you”, “…he is on time”, “…has a medical background” and so on. Respondents expressed their level of satisfaction with votes between zero and ten.
Nothing wrong to this point. Well, except that the interview was long. It took on average 43 minutes to go thru the whole questionnaire because all satisfaction questions were asked twice in order to gather the importance respondents assigned to each attribute, plus a few more questions, four of which were open-end. A long and tiring interview. But we were finished and had all our responses.
Measuring customer satisfaction is a two-step process
The question is “What comes next?” You might think we would use the study to identify areas of weakness to improve on and strength points to reinforce. Then we would launch activities to increase the satisfaction of customers and, say, three months later we would measure satisfaction again and hopefully see improved scores.
Unfortunately, this is not the way to use customer satisfaction surveys, or at least it is not the correct way at this stage of the research.
What we should do now is to validate the model, making sure we are measuring what we want to measure, and that we are doing so accurately. And what we want to measure is the level of satisfaction (S), in our case with the sales representative. Moreover, we think that the overall satisfaction of customers depends on satisfaction with the above 23 attributes (ai), but how do we know it?
Why should we validate the model? To save money and to get reliable data. In fact, what we have now is not information we can use to make decisions.
First, let me show you the sort of data we received. Then I will show you how to validate the model and why this is the most crucial part of any professional measurement of customer satisfaction. 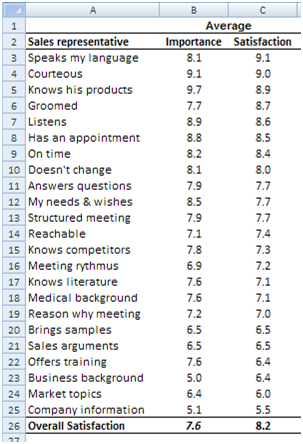
Image 2: Importance and Satisfaction average scores.
Frankly speaking this is not professional!
Allow me to simplify things. Image 2 is basically what we got from the agency: An Importance value and a Satisfaction value for each attribute shown in Image 1, and for the Overall satisfaction.
Image 3 helps in reading the data. According to the agency, this chart has four quadrants. The upper-right one hosts attributes that are important to customers, and we were doing well; in the lower-left quadrant we weren’t doing so well, but fortunately these were less important attributes. The problem children are in the lower-right quadrant. These are important attributes to customers and their satisfaction was below average.
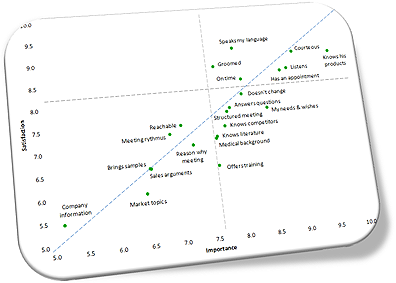
Image 3: Bi-variate plot of Importance and Satisfaction scores.
Make important decisions based on data like this and the odds are you are wasting money on useless activities. For instance, in the middle region of the chart are three attributes where we weren’t doing so well. The data, according to the above mentioned agency, suggests that we need to improve on the medical background of the rep, and the fact that s/he knows the technical literature and our competitors. In turn, improving on these attributes could have a positive influence on other attributes, such as: Answers questions, Sales arguments, or Market topics, and lift up overall satisfaction.
This seems to be a sound plan. But is it really? Let me show why not.
How to validate a customer satisfaction measurement model
We said our model is:
![]()
This means we can apply a common multiple regression of the attribute against the Overall satisfaction votes and we obtain the coefficients that are useful for screening attributes. We want to rank the effect of each attribute on the Overall customer satisfaction. Image 4 shows the coefficients we obtained. 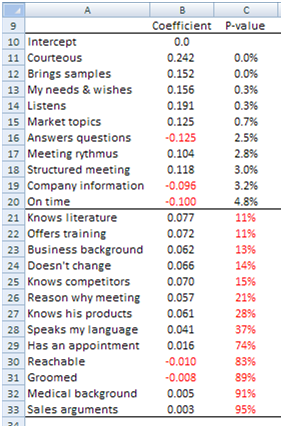
Image 4: Regression Coefficients and p-values.
Regression analysis uses an equation to describe the relationship between predictor variables (attributes) and the response variable (overall satisfaction). In our case, the p-value tests the null hypothesis that the attribute has no effect on the overall satisfaction. Low p-values (< 5%) suggest we can reject the null hypothesis. In other words, attributes with a low p-value are likely to be meaningful additions to our model.
Back to Image 4: all 13 attributes with a red figure in column C should be considered as useless additions to our model. And we are not finished yet. Now we run a second regression using only the meaningful attributes. Image 5 shows the results we get. 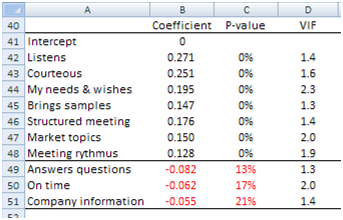
Image 5: Coefficients for the reduced set of attributes.
Again, three attributes do not perform well, so we remove them and run a third regression and we are left with the seven attributes shown in Image 6. This time all attributes make a significant contribution to the model[1]. 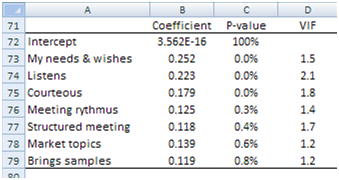
Image 6: Final attribute Coefficients useful for planning, e.g., activities aimed to increase customer satisfaction.
This analytical approach implies several technical caveats[2]. When, however, the practitioner who wants to approach the measurement of customer satisfaction correctly doesn’t have the technical background, this article may help in figuring out the process and how to use its output.
The last step: Measuring customer satisfaction with a valid model
We opened this article with three questions. The process we described answers the first two questions “How do we know these attributes measure satisfaction in a reliable way?” and “Are all attributes relevant and necessary?” The answer to the second question is obviously No, as we reduced them from 23 to seven.
The third question is still unanswered: “Can we estimate how much each attribute contributes to overall customer satisfaction?” And the answer is Yes, we can use the Coefficients shown in Image 6. These last coefficients, however, were obtained using the respondent satisfaction scores instead of the standardized values we used previously. This way we can bypass the limitations of the Pearson’s Correlation Coefficient, which does not work well with categorical data. Now we switch back to the original scores in order to estimate coefficients applicable to the original values (survey respondents used scores between 0 and 10).
How to estimate each attribute’s contribution to overall customer satisfaction
The Coefficients of Image 6 tell us how much each attribute contributes to overall satisfaction.
The coefficient in cell B73, for instance, tells us that, keeping all other coefficients unchanged, for every unit of change in the attribute Courteous the Overall Satisfaction increases by 0.252 units. This means, reading from Image 2, if the average satisfaction of attribute Courteous increases from the present 9.0 to 10.0, the Overall Satisfaction rises from 8.2 to 8.452.
This information is not only useful, it is crucial to the correct application of customer satisfaction surveys, because it empowers the survey user (the decision-maker) with the capability to plan exactly how much satisfaction to win with which attribute.
How professional marketers use customer satisfaction surveys
They make executive plans based on it, most often promotional activity plans.
For instance, Image 7 shows the selected attributes in bold black. On the ordinate (Y, vertical axis) we read the satisfaction scores and on the abscissa (X, horizontal axis) are the regression coefficients.
This chart can be used to hypothesize an activity pattern aimed to increase overall satisfaction. One option could be to strengthen attributes where we score low, even if they have a lower overall contribution, like Market Topics or Bring samples. One could consider testing one attribute at a time, i.e. running a promotional campaign for each and then measure which was the most effective. Over time one has collected the kind of prior knowledge marketers, and decision-makers in general, need to make fast decisions based on sound knowledge.
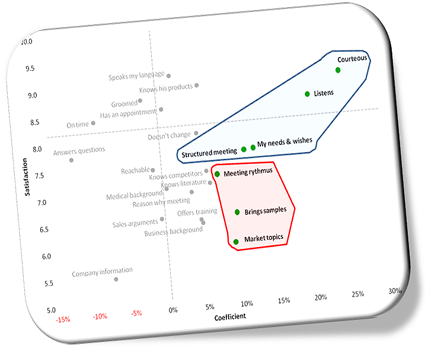
Image 7: Summary plot useful for visualizing the impact of regression coefficients on satisfaction scores.
If you like, tell me what patterns you think Image 7 suggests and I’ll reply to you. Otherwise, stay tuned. I’ll write soon about how to increase overall satisfaction.
Thank you for reading!
I’d appreciate if you would post this article to your social network.
[1] VIF stands for Variance Inflation Factor and measures multicollinearity. In our case all indexes are below 5, so no multicollinearity was detected. Multicollinearity refers to predictors (attributes) correlated with other predictors. When this happens the predictor Coefficient becomes inaccurate and choosing predictors to include in the model gets complicated.
[2] For instance, is it appropriate to standardize the input data, as we did? If not, what correlation coefficient do we use with categorical input data? What p-value threshold should be used? Should we instruct the model to set the Intercept to zero? What use should we do of the standard errors? What sample size should we gather? What scales of measurement for the variables? And so on. These however are issues a technician can solve with relative ease.