
For a recent University of San Francisco MBA class, I wanted to put my students in a challenging situation where they would be forced to make difficult data science trade-offs between gathering data, preparing the data and performing the actual analysis.
The purpose of the exercise was to test their ability to “think like a data scientist” with respect to identifying and quantifying variables that might be better predictors of performance. The exercise would require them to:
- Set up a basic analytic environment
- Gather and organize different data sources
- Explore the data using different visualization techniques
- Create and test composite metrics by grouping and transforming base metrics
- Create a score or analytic model that supports their recommendations
I gave them the links to 10 Warrior games (5 regulation wins, 3 overtime losses and 2 regulation losses) as their starting data set.
I then put them in a time boxed situation (spend no more than 5 hours on the exercise) with the following scenario:
You have been hired by the Golden State Warriors coaching staff to review game performance data to identify and quantify metrics that predict a Warriors victory
Here were the key deliverables for the exercise:
1. I wanted a single, easy-to-understand slide with in-game and/or player recommendations.
2. I wanted a break out of how they spent their 5 hours across the following categories:
- Setting up your analytic environment
- Gathering and organizing the data
- Visualizing and analyzing the data
- Creating the analytic models and recommendations
3. Finally, I wanted back-up information (data, visualizations and analytics) in order to defend their in-game and/or player recommendations.
Exercise Learnings
Here is what we learned from the exercise:
Lesson #1: It’s difficult to not spend too much time gathering and cleansing data. On average, the teams spent 50% to 80% of their time gathering and preparing the data. That only left 10% to 20% of their time for the actual analysis. It’s really hard to know when “good enough” is really “good enough” when it comes to gathering and preparing the data.
Lesson #2: Quick and dirty visualizations are critical in understanding what is happening in the data and establishing hypotheses to be tested. For example, the data visualization in Figure 1 quickly highlighted the importance of offensive rebounds and three-point shooting percentage in the Warriors’ overtime losses.
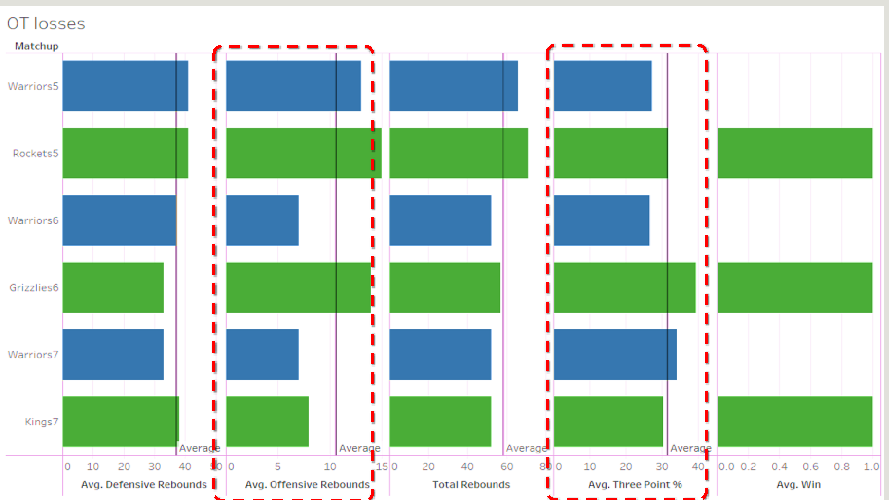
Figure 1: Use Quick Data Visualizations to Establish Hypotheses to Test
Lesson #3: Different teams came up with different sets of predictive variables. Team #1 came up with Total Rebounds, Three-Point Shooting %, Fast Break Points and Technical Fouls as the best predictors of performance. They tested a hypothesis that the more “aggressive” the Warriors played (as indicated by rebounding, fast break points and technical fouls), the more likely they were to win (see Figure 2).
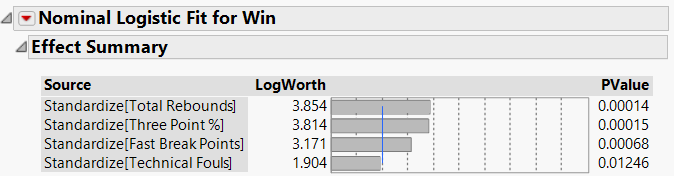
Figure 2: Testing Potential Predictive Variables
Team #2 came up with the variables of Steals, Field Goal Percentage and Assists as the best predictors of performance (see Figure 3).
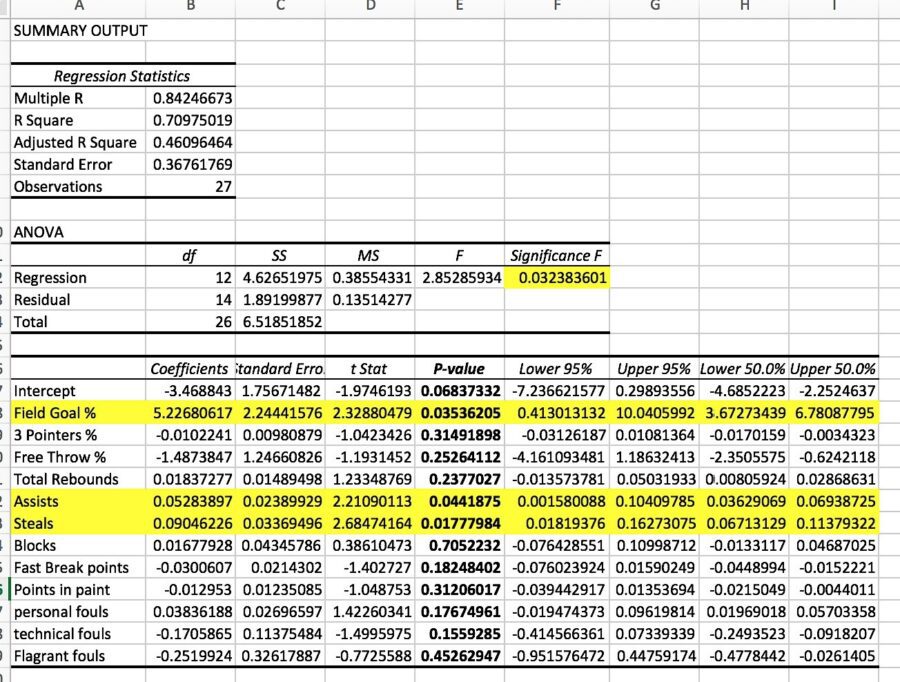
Figure 3: ANOVA Table for Team #2
Team #2 then tested their analytic models against two upcoming games: New Orleans and Houston. Their model accurately predicted not only the wins, but the margin of victory fell within their predicted ranges. For example in the game against New Orleans, their model predicted a win by 21 to 30 points, in which the Warriors actually won by 22 (see Figure 4).
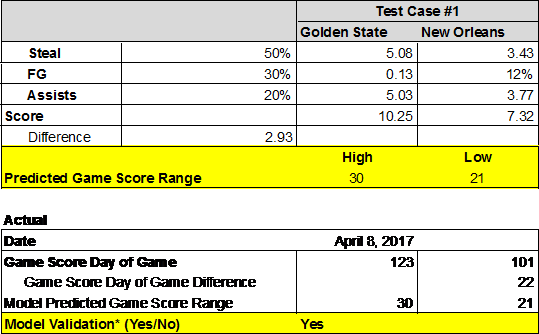
Figure 4: Predicting Warriors versus New Orleans Winner
And then in the Houston game, their model predicted a win by 0 to 10 points (where 0 indicated an overtime game), and the Warriors actually won that game by 9 points (see Figure 5).
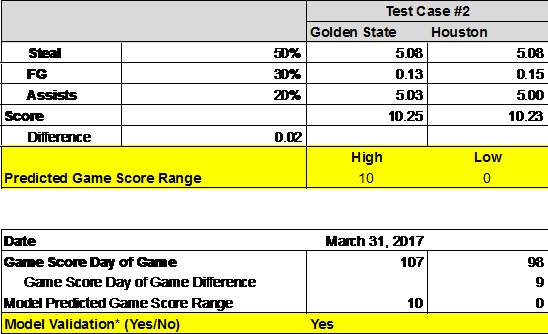
Figure 5: Predicting Warriors versus Houston Winner
I think I’m taking Team #2 with me next time I go to Vegas!
By the way, in case you want to run the exercise yourself, Appendix A lists the data sources that the teams used for the exercise. But be sure to operate under the same 5-hour constraint!
Summary
A few other learnings came out of the exercise, which I think are incredibly valuable for both new as well as experienced data scientists:
- Don’t spend too much time trying to set up the perfect analytic environment. Sometimes a simple analytic environment (spreadsheet) can yield consider insights with little effort.
- Start with small data sets (10 to 20GB). That way you’ll spend more time visualizing and analyzing the data and less time trying to gather and prepare the data. You’ll be able to develop and test hypotheses much more quickly with the smaller data sets running on your laptop, which one can stress test later using the full data set.
- Make sure that your data science team collaborates closely with business subject matter experts. The teams that struggled in the exercise were the teams that didn’t have anyone who understood the game of basketball (not sure how that’s even possible, but oh well).
One of the many reasons why I love teaching is the ability to work with students who don’t yet know what they can’t accomplish. In their eyes, everything is possible. Their fresh perspectives can yield all sorts of learnings, and not just for them. And yes, you can teach an old dog like me new tricks!

Figure 6: University of San Francisco Class of 2017 Big Data MBA
Appendix A: Exercise Data Sources
Extract “Team Stats” from the Warriors Game Results website: http://www.espn.com/nba/team/schedule/_/name/gs. Listed below is a cross-section of games from which you may want to use to start your analysis.
Wins
Rockets 1/20/17: http://www.espn.com/nba/matchup?gameId=400900067
Thunder 1/18/17: http://www.espn.com/nba/matchup?gameId=400900055
Cavaliers 1/16/17: http://www.espn.com/nba/matchup?gameId=400900040
Raptors 11/16/16: http://www.espn.com/nba/matchup?gameId=400899615
Trailblazers 1/2/17: http://www.espn.com/nba/matchup?gameId=400900139
Overtime (Losses)
Houston 12/1/16: http://www.espn.com/nba/matchup?gameId=400899436
Grizzles 1/6/17: http://www.espn.com/nba/matchup?gameId=400899971
Sacramento 2/4/17: http://www.espn.com/nba/matchup?gameId=400900169
Losses
Spurs 10/25/16: http://www.espn.com/nba/boxscore?gameId=400899377
Lakers 11/4/16: http://www.espn.com/nba/matchup?gameId=400899528
Cavaliers 12/25/16: http://www.espn.com/nba/matchup?gameId=400899899
Note: You are welcome to gather team and/or individual stats from any other games or websites that you wish.