
1. Introduction
Pandas
First, Pandas is an open source Python library for data analysis. It contains data manipulation and data structures tools designed to make spreadsheet-like data for loading, manipulating, merging, cleaning, among other functions, fast and easy in Python. It is often used with analytical libraries like scikit-learn, data visualization libraries like matplotlib, and numerical computing tools like NumPy and SciPy.
1.1 Introduction to pandas Data Structures
Pandas has introduced new data types to Python: Series and DataFrame. This two workhorse data structures are not a universal solution for every problem, but they provide a solid basis for most applications. The DataFrame represents your entire spreadsheet or a retangular table of data, whereas the Series is is a single column of the DataFrame.
Series
A Series is a one-dimensional array-like object containing a sequence of values and an associated array of data labels, called its index. It is similar to the built-in Python list.
Here is an example of an array of data.
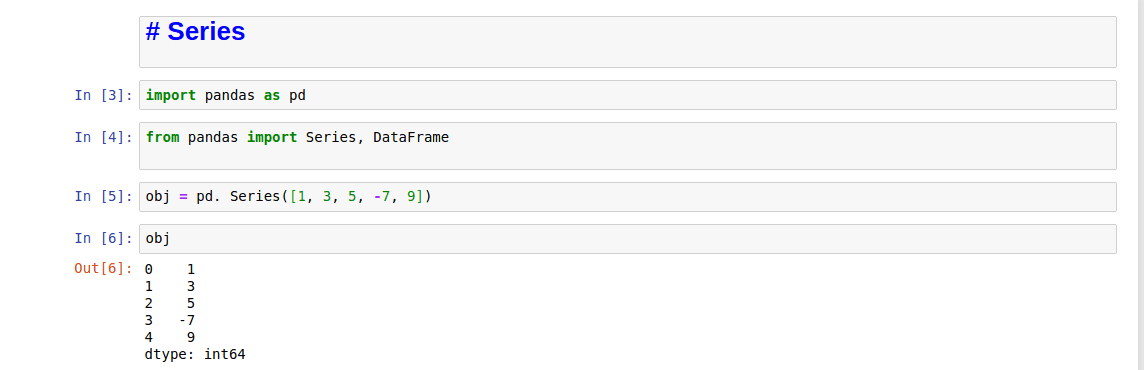
An array of data
This is a string representation of a Series. It shows the index on the left and the values on the right. We have not specifyed an index, so a default one is created. You can get the array respresentation and index object of the Series via its values and index attributes, respectively:
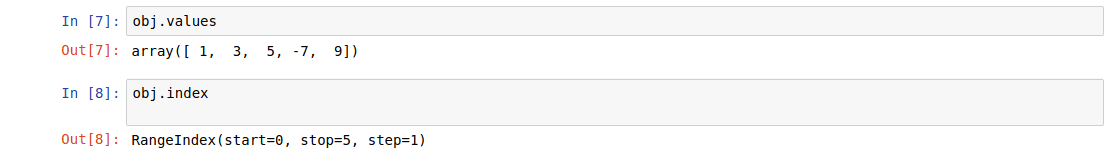
Array representation and index object
You can create a Series with a label pointing to each data:
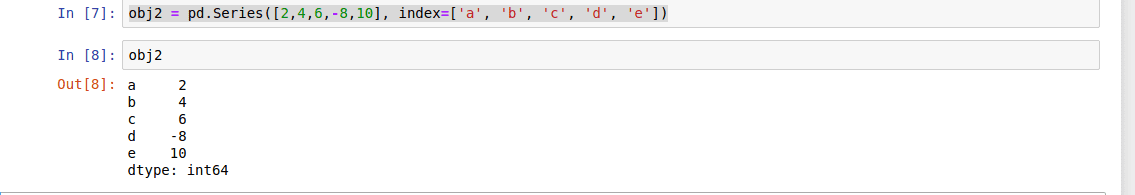
Array representation with a label
Additionally, you can use labels in the index when selecting a single value or a set of values:
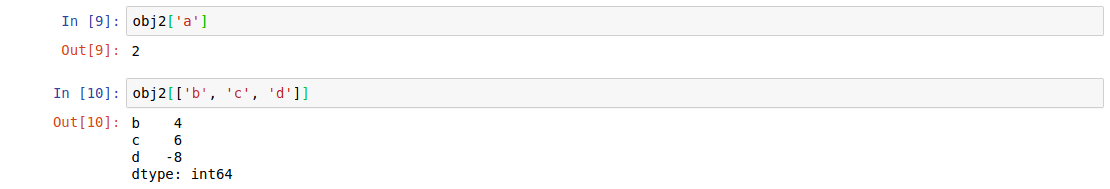
A single value and a set of values
Also, we can use NumPy functions or NumPy-like operations, such as scalar multiplication, filtering with a boolean array, or applying math functions, will preserve the index-value link:
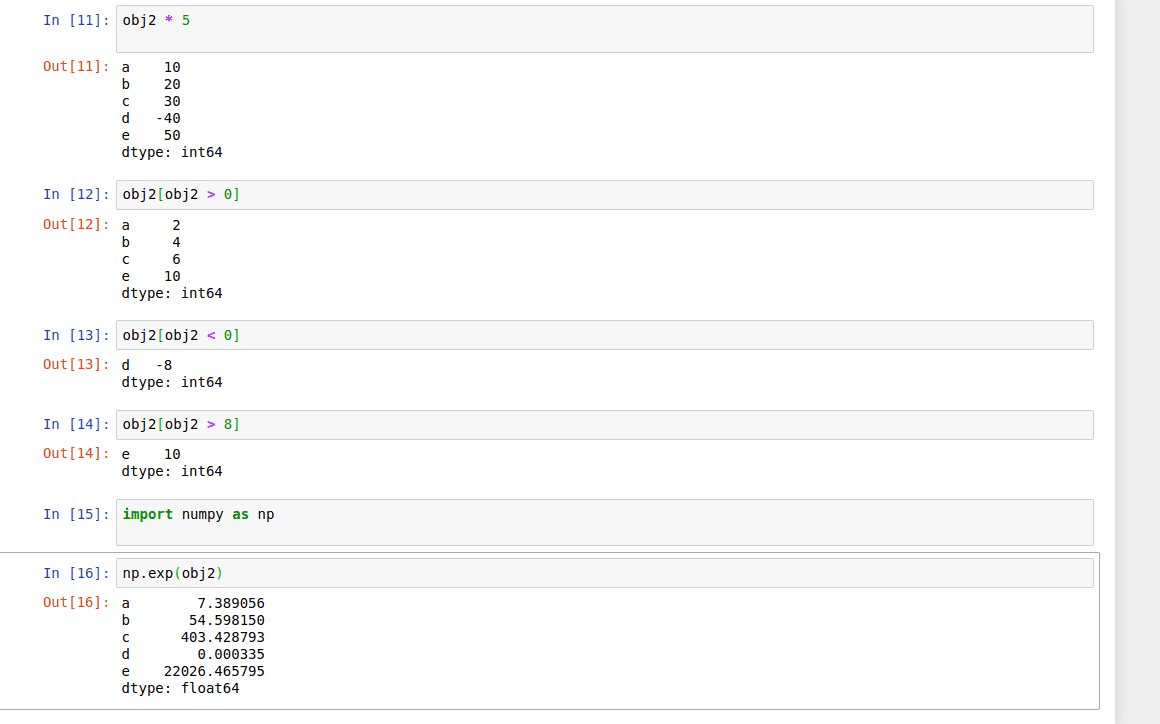
NumPy functions and NumPy-like operations
We can use Series as a specialized dictionary. A dictionary is a structure that maps arbitrary keys to a set of arbitrary values, and a Series is a structure that maps typed keys to a set of typed values.
We can make the Series-as-dictionary analogy even more clear by constructing a Series object directly from a Python dictionary:
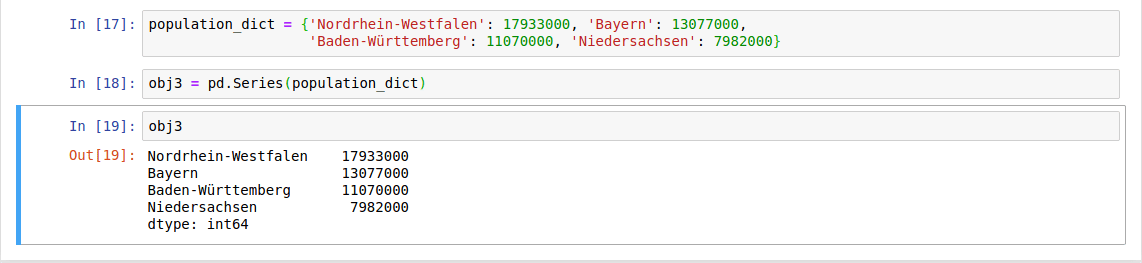
Series as dictionary
By default, a Series will be created where the index is drawn from the sorted keys. From here, typical dictionary-style item access can be performed:

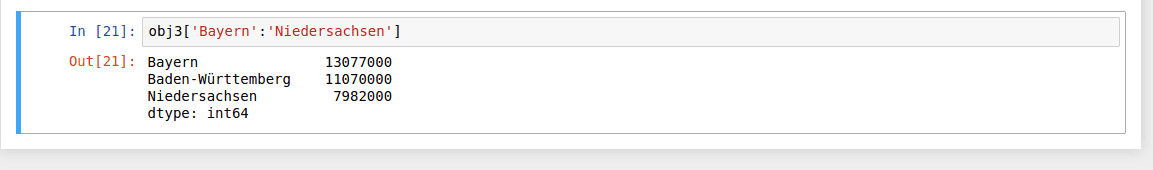
Unlike a dictionary, though, the Series also supports array-style operations such as slicing:
When you are only passing a dict, the index in the resulting Series will have the dict’s keys in sorted order. You can override this by passing the dict keys in the order you want them to appear in the resulting Series:
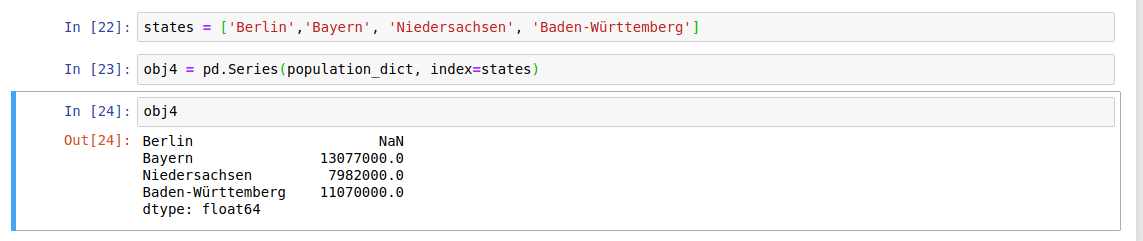
override
Since there is no value for ‘Berlin’, it appears as NaN(Not a Number).
Now you can detect the missing data with isnull and notnull functions.
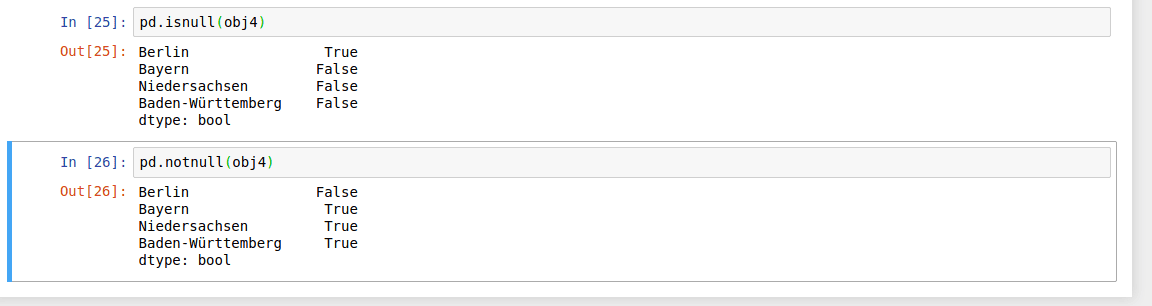
isnull and notnull funcitons
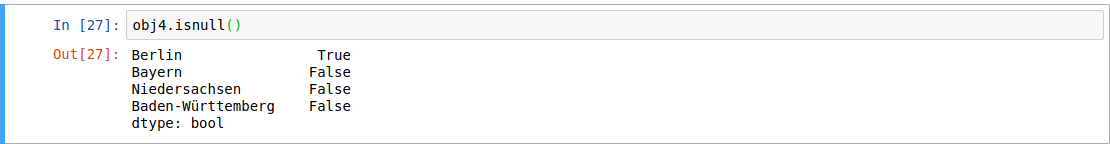
Series also has these as instance methods:
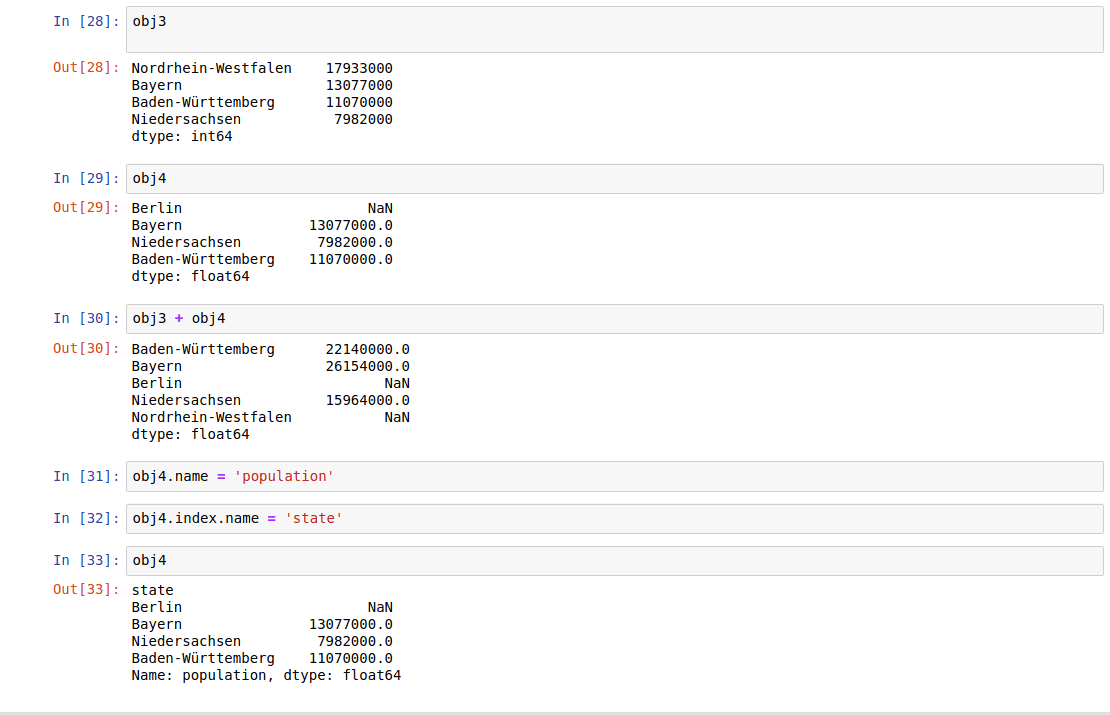
For arithmetic operations, the series functions are automatically aligned according to the index name. In addition, both the series object itself and its index have a name attribute:
DataFrame
First of all, let’s clarify the term DataFrame.
In Pandas it is a two-demonsional size-mutable, potentially heterogeneous tabular data structure with labeled axes (rows and columns). Arithmetic operations align on both row and column labels. Can be tought of as a dict-like container for Series objects. Under the hood, the data is stored as one or more two-dimensional blocks rather than a list, dict, or some other collection of one-dimensional arrays.
data.frame
Data Frames The function data.frame() creates data frames, tightly coupled collections of variables which share many of…
Let’s have a look at this.
Let’s first construct a new Series listing the area of each of the four states discussed before. Now that we have this along with the population Series from above, we can use a dictionary to construct a single two-dimensional object containing this information:
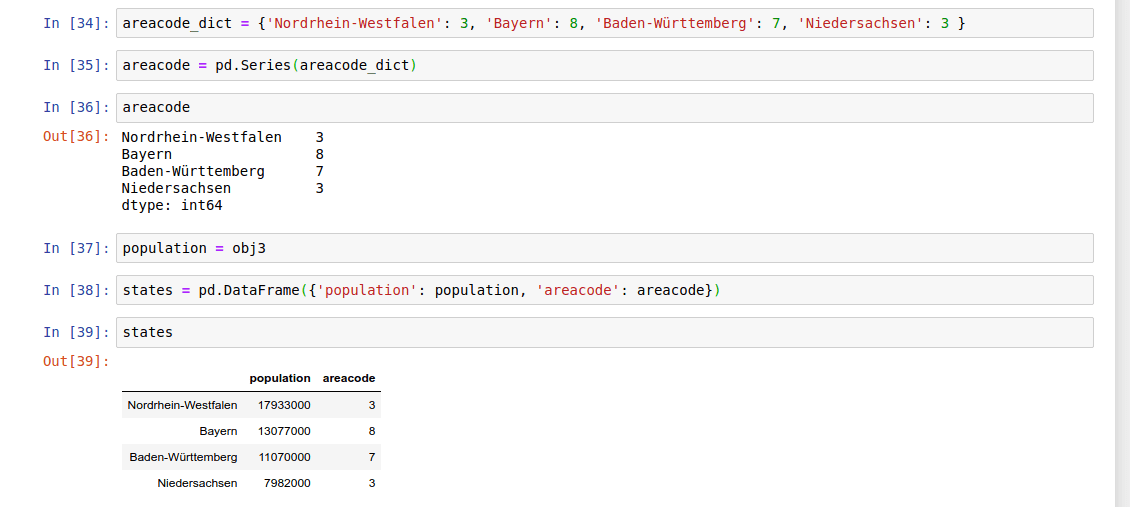
Now we can access the index labels via the DataFrame index attribute.The DataFrame also has a column attribute, which is an index object that contains the column labels.
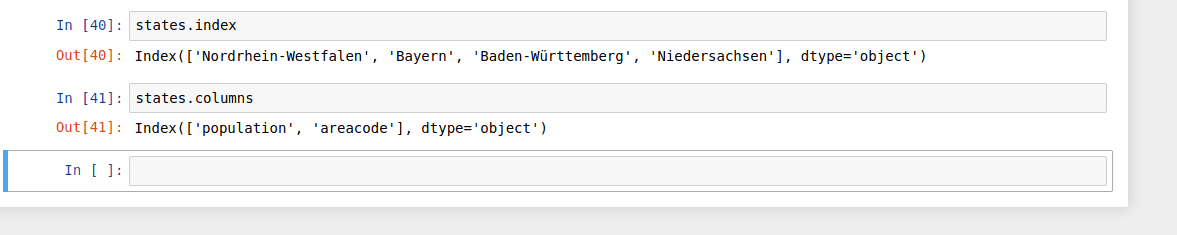
Index Attribute
Therefore the DataFrame can be thought of as a generalization of a two-dimensional NumPy array, where both the rows and columns have a generalized index for accessing the data.
We can also think of a DataFrame as a specialization of a dictionary. The DataFrame maps a column name to a Series column data, where a dictionary maps a key to a value. Now we get the Series object:
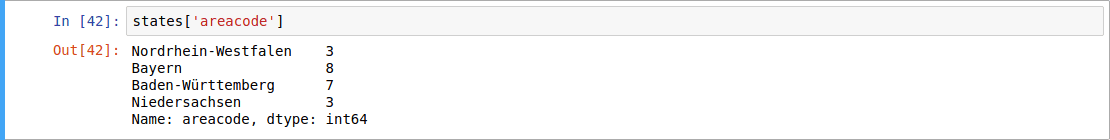
Mapping
Note: For a DataFrame, data[‘col0’] will return the first column. In a two-dimensional NumPy array, data[0] will return the first column.While a DataFrame is physically two-dimensional, you can use it to represent higher dimensional data in a tabular format using hierarchical indexing (also known as multi-indexing) to incorporate multiple index levels within a single index. Hierarchical indexing is more common practices but Pandas provide also Panel and Panel4d objects that handle three-dimensional and four-dimensional data.
We can construct DataFrame Objects in a variety of ways.
- From a list of dicts
- From a single Series object
- From a dictionary of Series objects
- From a two-dimensional NumPy array
- From a NumPy structured array
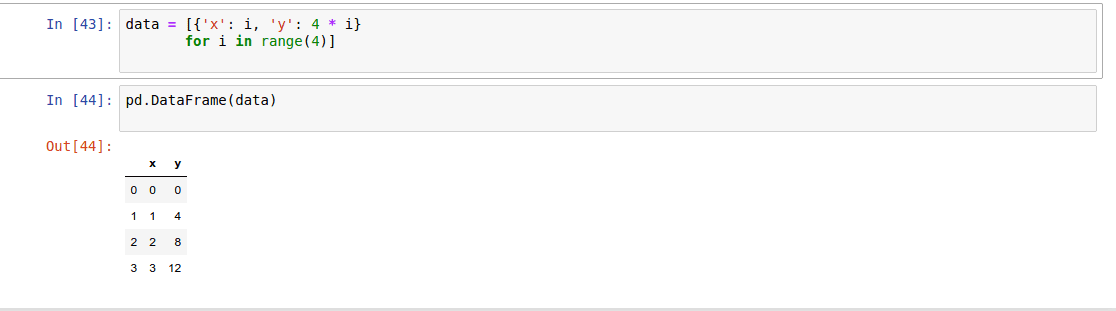
From a list of dicts
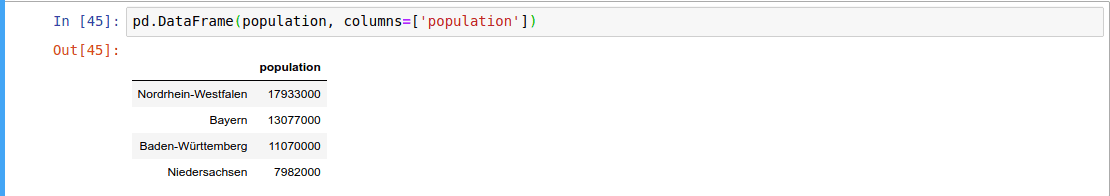
From a single Series object
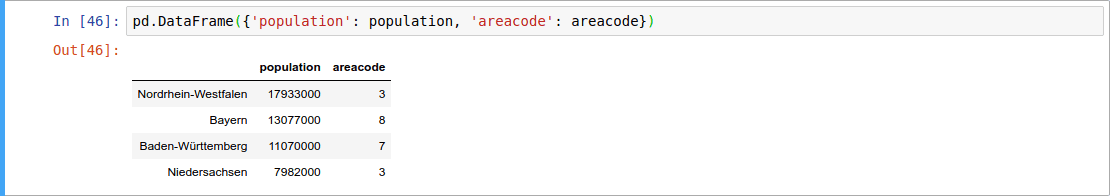
From a dictionary of Series objects
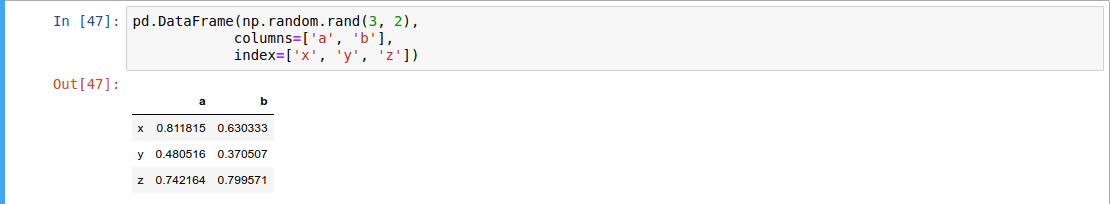
From a two-dimensional NumPy array
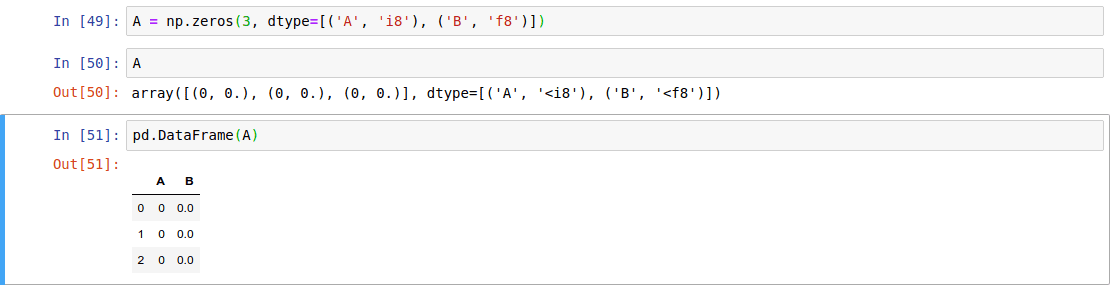
From a NumPy structured array
This was a short intro to Data Analysis with Pandas. For further reading you can grap this book from O’Reilly Python for Data Analysis, 2nd Edition by Wes McKinney. In addition, you should definitely browse through the reference and of course try it out. Also, you can try the code on https://mybinder.org/v2/gh/MehmetGoekce/PandasRepo/master.
Originally posted here