
Our client was a pioneering company in producing and delivering Roof Shingles. Their main plant in Minnesota and they have around 25 more plants across US. Client implemented 100’s of sensors along the assembly line that are streaming nano-second data to their Spark Data-lake.
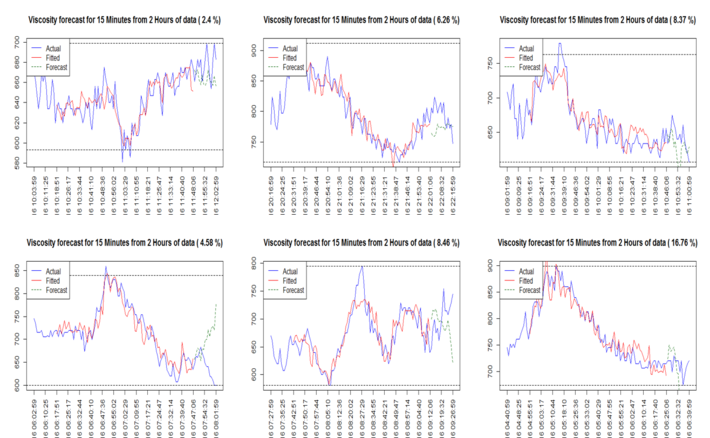
Viscosity of input fluid is an important factor to maintain quality of production of roof shingles. Data shows there are unwanted peaks (outliers) in viscosity data which client wanted to eliminate. Following are the steps we thought of
- Monitoring Viscosity continuously in a dashboard at the plant
- Finding the significant contributors in the fluctuations of the Viscosity values
- Perform a root cause analysis (RCA) of the unwanted peaks
SPARK Repository was implemented to hold sensor records and displayed them in a plant dashboard after minor pre-processing. Multiple Regression in R was used to find out significant contributors in viscosity fluctuations. Decision Tree was used to perform the Root Cause Analysis for the Web Tears (broken roof shingles). Lead Regression on significant variables was implemented to forecast viscosity. The modelling was successful and was implemented using SparkR.