
In a recent blog, I described the American Psychiatric Association’s Diagnostic and Statistical Manual of Mental Disorders as an ontological reference. I explained how this type of resource can be used for the codification of distributable events in order to build up a database. In an organization, although the context surrounding the idea of a “disorder” is different; nonetheless the concept of examining people in relation to their disorders can be applied to a production setting – i.e. to study disorders of production. Accepting that a disorder is not necessarily absolute but contextual and possibly constructed through social interactions and regulated behaviours, I offer an ecosystemic conceptualization of distributable events in what I call the Teratogenic Hex Event Distribution Model.
I was listening to the radio on my way to work one morning. I heard about the CEO of a hospital conducting an informal investigation of her employees. She was concerned about reported cases of deviant behaviour; in the context of a production environment this might be more commonly described as undesirable or at least unproductive behaviour. “Teratogenesis” means “the making of monsters.” In other blogs, I explained how the term “social teratogenesis” can be used in relation to how systems or patterns of external interaction contribute to the internal transformation of individuals – for example, in relation to how employees treats clients or in this case patients.
The problem with failing to follow employees at an individual level isn’t simply about eliminating the need for an elaborate system to recognize, score, and reward exceptional service; it also means being unable to punish for poor service or in some cases criminal behaviour. Lack of oversight invites deviant ideations since there is no threat of consequence. The behaviours that occur within the organization might then become an external consideration for example when law enforcement and lawyers become involved. In a sense by allowing the continuation of deviance, an organization “subsidizes” non-productive behaviours. A firm starting point is always to start collecting data and to follow problems as they develop. At the beginning, it is necessary to question what kind of data should be collected. This is no simple matter when perhaps even the underlying problems have not been fully articulated.
A tempting starting point is a “needs assessment,” which I suggest is only a useful if the ultimate objective is “consensus building.” If the idea is for people to form a chain, hold hands, and start singing together at some point, yes by all means consider this type of assessment since it is a fine way to come to an agreement. However, in a setting where there are entrenched cultural biases – and these may have contributed to the problems in the first place – forming a consensus is probably not the best outcome. Assuming the end-goal is correction or mitigation, perhaps the better approach is simply start mapping out problematic behaviours; this is a long-term and ongoing process as the behaviours are detected and suppressed. The organization gradually develops a resistance to the illness.
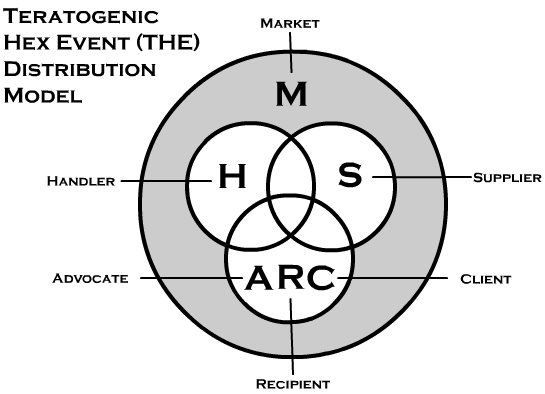
The model contains six main components (hence, “hex”). I will describe these parts in relation to a hospital: (S) the supplier is the hospital itself as an organization; (H) a handler is a nurse, doctor, or other employee that interacts with patients; (M) the market is external to the interaction although it contains forces that affect load and capacity; (C) the client to be specific is the person who makes decisions (or pays for service) although this is not always the patient; (R) the service recipient who is not necessarily the person making decisions (or paying for service) although it might be; and (A) an advocate is likely a government agency or agent interested in services rendered. Consequently, the model can have three exceptionally different types of clients. Within these divisions, it is possible to have a multitude of subdivisions: e.g. there are usually many types of handlers in a hospital.
There are different types of events that can be generated from this hex. The main categories are as follows: disorders, syndromes, compulsions, and behaviours (not included as compulsions). For codification purposes, I use these terms in specific ways that others might not. For example, for coding, I define a “syndrome” as a pattern of falsification or false portrayal. Maintaining an outward persona (a person who loves the job) that is quite different from the inward persona (a person who hates the job) can be regarded as a syndrome. How would an observer know the difference? Well, the demonstrated ability to flip between personas would be a sign. Whether or not a person who lies on one level might be willing to do so in different ways on other levels is a matter of analysis. Moreover, the question of whether a disagreement in identity is positive or negative for business is a separate issue. The syndrome becomes problematic at an operational level if the expressed willingness to do a job nonetheless leads to the job not being done; this can be reasonably expected to lead to adverse outcomes, thus forcing the syndrome to be addressed through data collection and analysis.
It is fair to question my reasons for introducing such an elaborate ontological schema for event distribution. It is important to distinguish between distributing events and solving business and operational problems. Event distribution is a means to an end towards the latter. If there is lack of cohesiveness or precision, it will be difficult during the analysis to determine what exactly is being monitored, how it should be corrected, and why. The ontological process is therefore the foundation on which everything else sits.
What do I mean by teratogenesis in relation to events? There are certain unproductive behaviours that people exhibit in the workplace; and there is probably little doubt on the adverse nature of these behaviours. For instance, stealing from a patient is wrong. But there are also many grey patches where the exact impacts are not entirely clear at least at the outset; and this makes it difficult to approach the perpetrator to request corrective action. In these dimly lit areas, I personally like the idea of ergatigenic solutions: the making of workers through external or structural implements. A type of teratogenic event involves the mindset of being on the job not so much to serve patients but primarily to receive a salary – i.e. a radical materialist response to stress.
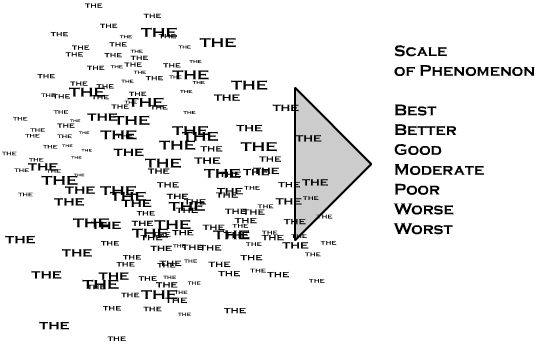
Once events are distributed, there are different ways to handle the analysis. Probably the most conventional approach would be to count the incidents over discrete periods: e.g. number of cases per week or month. Since the events are meant to be teratogenic in nature, trend analysis might point to potential problems emerging purely from the patterns. However, I suggest that since events sometimes occupy a grey area where the impacts are unclear, trend analysis should be accompanied by algorithmic impact analysis. The crosswave differential algorithm is designed to associate events with a scale or gradient representing a type of production metric. As shown above, the algorithm can count the number of events associated with each phenomenal hierarchical element.
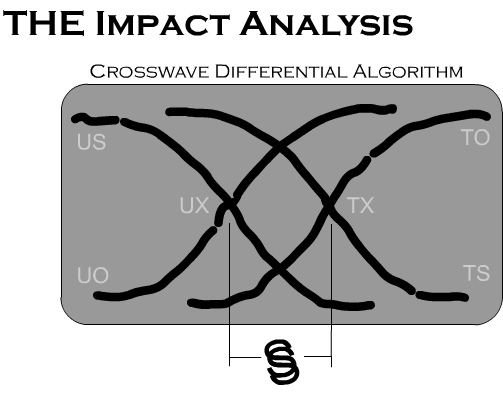
The crosswave differential algorithm – as its name suggests – uses the difference between two crossing waves. This differential is the difference between “treated” and “untreated” events – not exactly in the sense of an independent variable in a scientific experiment. Simulation testing has shown the effectiveness of this algorithm, which I personally developed many years ago. This algorithm is demanding in terms of computer processing power. I would therefore employ algorithms of this type using extracted samples of data.
The next image summarizes the overall process. I added the initial step of data collection either through active or passive means. Those that have followed my blogs over the years might be aware that I collect data for “quality inspection” purposes. While this remains true even today – that is to say, I check the work that people do – I am no position to track their progress either through conventional trend analysis or algorithmic impact analysis. I have no means to distribute events using either gradient or interval distribution. (However, I have event distributors at home that I programmed myself.)
The approach described in this blog is generally unfriendly to automated data-loggers or mass compilations. The events are quite complex, specific, precise, and relatively infrequent. Data-loggers and compilations are more suited for high-volume generic events – e.g. the number of hamburgers sold by a fast food restaurant. However, it is possible to use the mass log or compilation to formulate the performance gradients. In a question such as “how can this organization increase patient satisfaction?” it is tempting to think of the satisfaction levels from a survey as something that provides guidance. But actually the measurements lack ontological structure. It is difficult to know how to increase satisfaction levels on the absence of structural data.
The fact that the number of calls to a call centre is increasing or decreasing doesn’t help matters at least from the standpoint of control. It is necessary to dip into the ontological database to ascertain the construction behind those calls. The attempt to control the trends of those events can help the organization gain control over the outcomes. If an organization is only examining and engaging the outcomes, I believe this can create problems when things go awry. It becomes quite difficult to alter those outcomes.

Regardless of the nature of the operation – whether it is a call centre, factory, hospital, or private school for boys – the absence of data suggests complacency or even complicity. Legitimacy is built on data. However, it isn’t just any kind of data that counts. It is important to put some effort into the conceptualization: this allows data pertaining to the outcomes of operations to be traced back to the antecedents or the constructs of production. While the world of analytics is often preoccupied with outcomes – perhaps because these metrics are relatively easy to collect – the task of management is probably better served by focusing on ontological considerations and the distribution models that handle non-parametric events.