
 The other day, I came across a Quora question I just had to answer. This is not unusual for me. It wasn’t that the question itself didn’t deserve an answer. It was that one of the respondents appeared to be as ill-informed as the questioner, thus reinforcing the questioner’s initial impression with a wrong answer.
Because it was a question about knowledge graphs, I couldn’t let this go. I felt compelled to give a reasonable answer.
The question was this one: Is a knowledge graph just another means of knowledge visualization? My answer was no. I explained why, saying that the main purpose of a knowledge graph is to get machines and humans on the same page so machines can help us more.
How do knowledge graphs do this? By articulating and abstracting the representations of people, places, things and ideas and how they relate to one another and interact in a way that’s mutually understandable and scalable.
This week it occurred to me the term “data intelligibility” could have helped convey a better meaning when answering why. Much of the frustration of working with machines is that they don’t “know” much and can’t “associate” much without explicit clues.
And yet, the data machines are fed today is a bit like white flour–a macronutrient that started as wheat, but with almost all but its caloric and baking medium value stripped away. Then data chemists blend in additives–sugars, flavor enhancers, vitamins, preservatives so that the “enriched” flour serves its purpose as a medium for baking.
The most intelligible and therefore useful data, by contrast, is data that stays rich to begin with and is further enhanced with other macro- and micronutrients (complementary datasets and the right relationships to create business contexts) that carry much of their original nutritional value.
More intelligible data enables a higher level of machine intelligence
Machines certainly compute well, and with the help of machine learning, they can certainly recognize complex patterns. With enough training data, they can pick up on what’s depicted in some photos, among many other recognition tasks. But they don’t know enough to escape their limitations in other ways that could radically extend the capabilities of social robots, for example.
A semantic graph-based data-centric architecture uses data in the form of a knowledge graph to express machine- and human-readable logic that lives with the data. In this way, tiers of understanding can be generated and built dynamically over time.
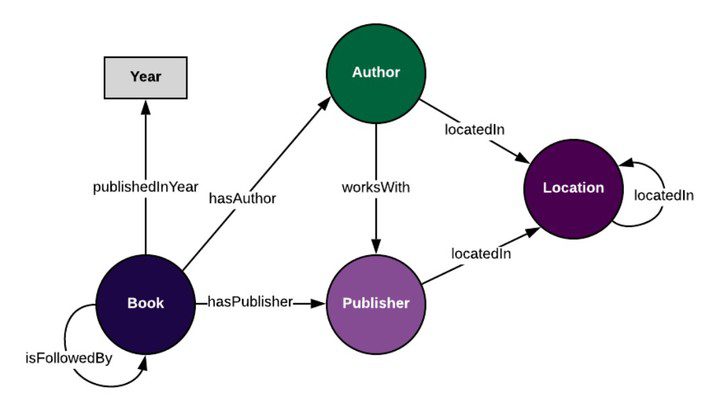
A graph example can help illustrate what I mean. The classes represent a publisher, author, and a book published. The relationships between these and the date of publication are the connecting context. In other words, the relationship logic becomes part of the overall data fabric with the help of this semantic graph data model, or ontology.
Bess Schrader, “What’s the Difference Between an Ontology and a Knowledge Graph?”
January 15, 2020, Enterprise Knowledge blog, https://enterprise-knowledge.com/whats-the-difference-between-an-ontology-and-a-knowledge-graph/
The data about specific books, publication date, publisher, author and location then serves as the instance data to populate the rest of the graph.
The tiers of meaning that knowledge graphs can contain when fully populated with ontological context and the instance data for those contexts range from the very specific (stock keeping units or SKUs, for example) to the fully abstract (things). This means of making explicit how concepts (some of which represent physical things) are related.
Levels of data intelligibility
How useful is the data you’ve gathered? Data intelligibility describes how well the representations in data convey some level of “understanding” to machines while being interpretable by humans. The broader and deeper the understanding, the more useful the data.
Data can be used to represent anything in the physical or conceivable world, including much of the logic. Ideally, when it comes to intelligibility, data that includes relevant connecting logic equals a lingua franca that can enable human-machine feedback loops, a means of enriching data intelligibility.
Now consider how levels of data intelligibility can map to incrementally more complex levels of human understanding. Education theorist Kieran Egan observed that individuals master one of the following five kinds of understanding in this order:
|
Level of human understanding |
Example abilities acquired |
Age acquired |
|
Somatic |
Core physical abilities, mimicry |
0-2 |
|
Mythic |
Binary or simple distinctions: Right versus wrong, archetypes and stereotypes, imaginative thinking |
3-7 |
|
Romantic |
Gradations of differences (rather than just binary distinctions), improved literacy, communications and social skills |
8-14 |
|
Philosophical |
Logical thinking including abstracting, theorizing, gathering facts to support theory |
15-20 |
|
Ironic |
Questioning, skepticism, dark or subtle humor |
21+ |
Kieran Egan, The Educated Mind: How Cognitive Tools Shape Our Understanding, 1998, and Joseph D’Addario, “Five Kinds of Understanding,” Edureach, July 17, 2017, https://edureach101.com/5-kinds-of-understanding/
Note how these human levels of understanding parallel the levels of machine intelligence that exist today. Much of the recent struggles in the world of bipedal or quadrupedal robotics, for example, had to do with achieving basic mobility and mimicking human behavior accurately (Somatic level).
The Mythic and Romantic levels describe how more and more nuanced distinctions, or disambiguations, become possible for children as they move into their school years. Social robots hint at, but don’t achieve these levels yet.
Finally, the Philosophical and Ironic levels underscore the reasoning and questioning power adults acquire to allow them to gain the independence and skill to join the workforce.
A knowledge graph in this context is data articulated with the help of a semantic graph model in the form of description and relationship logic. Such a graph conveys the meaning necessary to machines so they can help humans use one or more data resources in ways they couldn’t on their own.