Overview
In the customer management lifecycle, customer churn refers to a decision made by the customer about ending the business relationship. It is also referred as loss of clients or customers. Customer loyalty and customer churn always add up to 100%. If a firm has a 60% of loyalty rate, then their loss or churn rate of customers is 40%. As per 80/20 customer profitability rule, 20% of customers are generating 80% of revenue. So, it is very important to predict the users likely to churn from business relationship and the factors affecting the customer decisions. In this blog post, we are going to show how logistic regression model using R can be used to identify the customer churn in the telecom dataset.
Learning/Prediction Steps

Data Description
Telecom dataset has the details for 7000+ unique customers, where details of each customer are represented in a unique row and below is the structure of the dataset:  Input Variables: These variables are called as predictors or independent variables.
- Customer Demographics (Gender and Senior citizenship)
- Billing Information (Monthly and Annual charges, Payment method)
- Product Services (Multiple line, Online security, Streaming TV, Streaming Movies, and so on)
- Customer relationship variables (Tenure and Contract period)
Output Variables: These variables are called as response or dependent variables. Since the output variable (Churn value) takes the binary form as “0” or “1”, it will be categorized under classification problem in the supervised machine learning. 
Data Preprocessing
- Data cleansing and preparation will be done in this step. Transforming continuous variable into meaningful factor variable will improve the model performance and help understand the insights of the data. For example, in this dataset, the tenure interval variable is converted to factor variable with range in months. Thus, understanding the type of customers with tenure value to perform churn decision.
- As part of data cleansing, the missing values are identified using the missing map plot. The telecom dataset has minimal number of missing value record and is dropped out from analysis.


- Custom logic is implemented to create derived categorical variable from the tenure variable and continuous variables. As it will not affect the prediction value, customer id and tenure values are dropped from further process.

- New categorical feature is created as mentioned above.

- Few categorical variables have duplicate reference values and it refers to the same level. For example, “MultipleLine” feature has possible values as “Yes, No, No Phone Service”. Since “No” and “No Phone Service” have the same meaning, these records are replaced with unique reference.

Partitioning the Data & Logistic Regression
- In the predictive modeling, the data need to be partitioned into train and test sets. 70% of the data will be partitioned for training purpose and 30% of the data will be partitioned for testing purpose.
- In this dataset, 4K+ customer records are used for training purpose and 2K+ records are used for testing purpose.
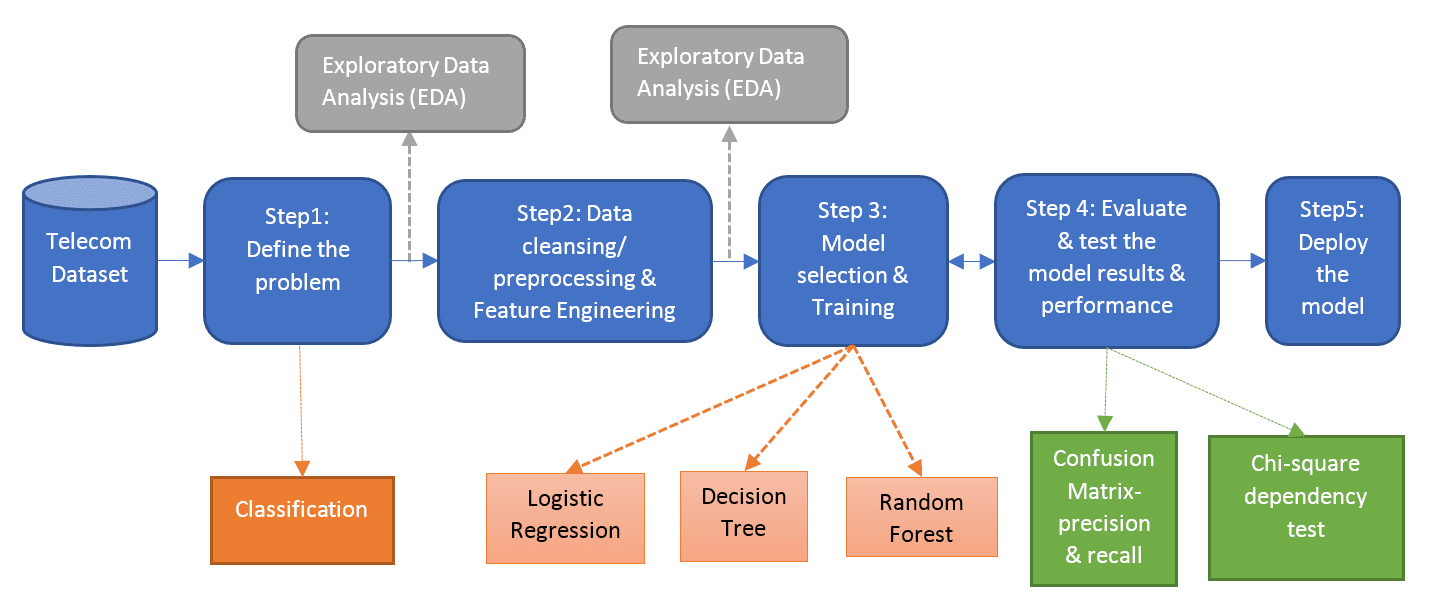
- Classification algorithms such as Logistic Regression, Decision Tree, and Random Forest can be used to predict chrun that are available in R or Python or Spark ML.
- Multiple models can be executed on top of the telecom dataset to compare their performance and error rate to choose the best model. In this blog post, we have used Logistic Regression Model with R using glm package. Future blogs will focus on other models and combination of models.

Model Summary
From the model summary, the response churn variable is affected by tenure interval, contract period, paper billing, senior citizen, and multiple line variables. The importance of the variable will be identified by the legend of the correlated coefficients (*** – high importance, * – medium importance, and dot – next level of importance). Rerunning the model with these dependent variables will impact the model performance and accuracy. 
Prediction Accuracy
- Models built using train datasets are tested through the test dataset. Accuracy and error rate are used to understand how these models are behaving for the test dataset. The selection of the best model is determined by using these measures.
- Confusion Matrix/ Misclassification Table: It is a table used to describe the performance of the classification model on a test data. It is used to cross-tabulate the actual value with the predicted value based on the count of correctly classified customers and wrongly classified customers.

- The various measures derived from the confusion matrix are:

- With the choice of logistic regression, it is evident that the accuracy for this model is evaluated as 80% and error rate as 20%. The accuracy of the model can be improved with other classification models such as decision tree, and random forest with parameter tuning.
To read original post & the code downloads, click here
