
Power BI provides slicers for a single column, but there are scenarios where it could be useful to consolidate alternative filters for multiple columns in a single slicer. Technically, this is not possible in Power BI through the standard visualizations, but you can use a particular data modeling technique to obtain the desired result.
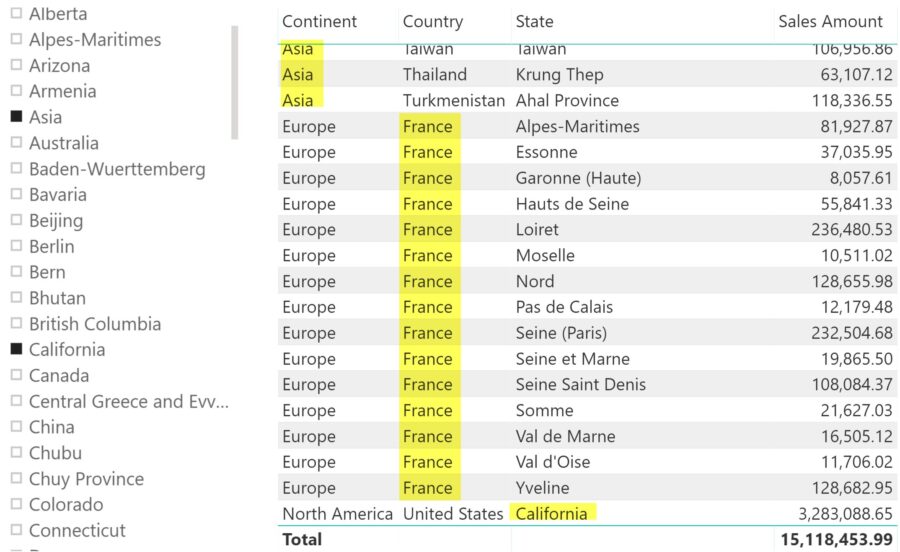
Consider the case of a Customer table with a geographical hierarchy with Continent, Country, and State. The requirement is to enable a filter over California (State), France (Country), or Asia (Continent) using a single slicer, as shown in the following screenshot.
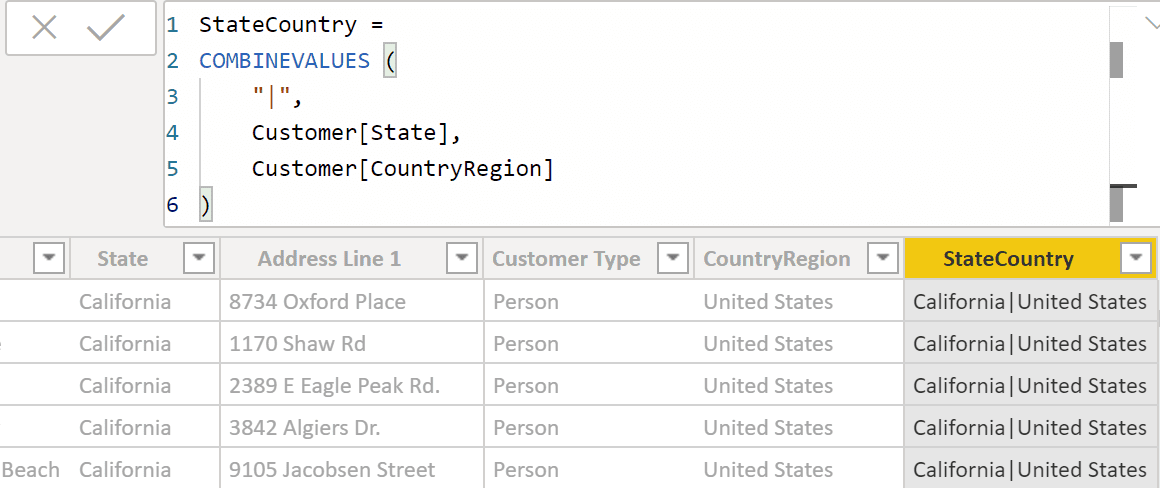
The first step required to implement the solution is creating a calculated column in the Customer table that defines the granularity for the filter. Because the State could be not unique, we create a calculated column in the Customer table by concatenating State and Country. The Continent column is not required because each Country belongs to only one Continent – in a different situation, consider concatenating all the columns that define a unique value for each row of the table.
StateCountry = COMBINEVALUES ( "|", Customer[State], Customer[CountryRegion] )
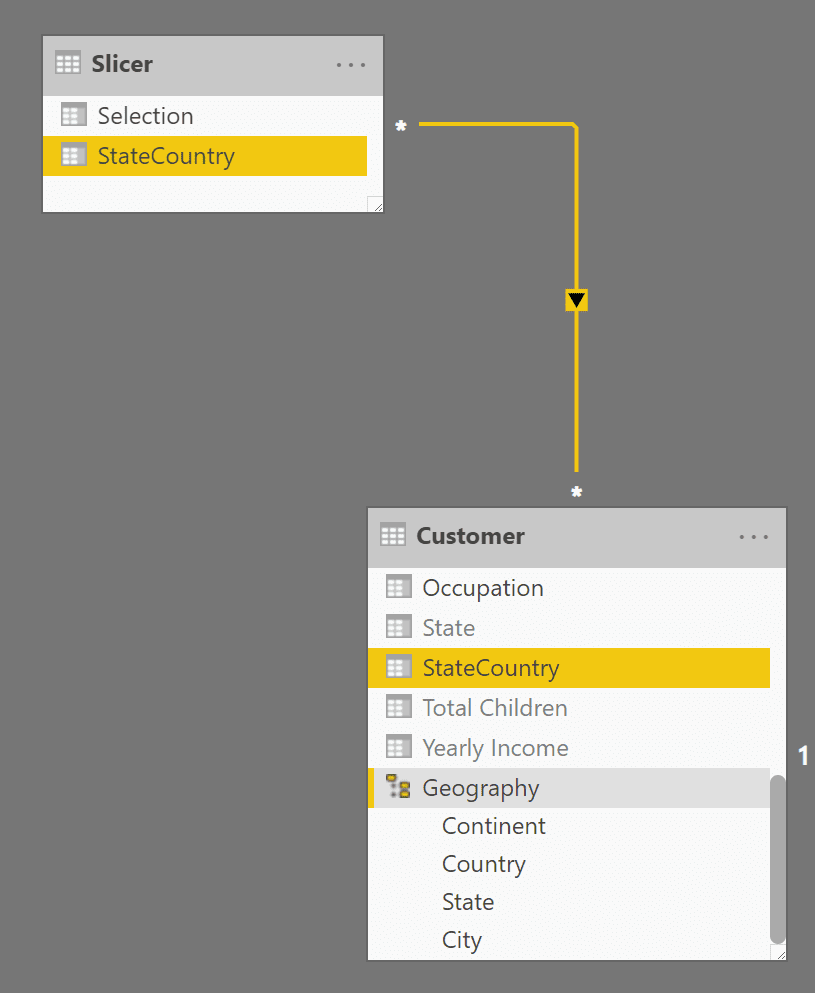
The StateCountry column is needed to create a relationship with the table Slicer that shows the possible choices in a single item. Such a table has a Slicer[Selection] column with at least one value for each item that is displayed in the slicer, and all the combinations of StateCountry values to filter for each possible selection.
The Slicer table obtained this way must have a relationship between Slicer[StateCountry] and Customer[StateCountry]. This relationship has a many-many cardinality and a single filter direction, so that Slicer filters Customer (and not the opposite).
Slicer = DISTINCT ( UNION ( SELECTCOLUMNS ( Customer, "Selection", Customer[State], "StateCountry", Customer[StateCountry] ), SELECTCOLUMNS ( Customer, "Selection", Customer[CountryRegion], "StateCountry", Customer[StateCountry] ), SELECTCOLUMNS ( Customer, "Selection", Customer[Continent], "StateCountry", Customer[StateCountry] ) ) )
Now the model is ready. By selecting an item in the slicer, you apply a filter to the Slicer[Selection] column. This filter automatically propagates to the column Customer[StateCountry] thanks to the relationship created in the last step. This is the model that supports the report shown at the beginning of this article.
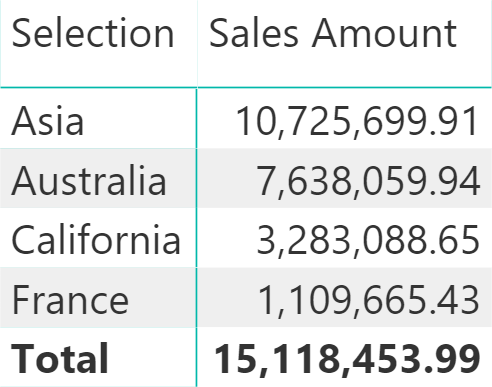
Clearly, the Slicer[Selection] could be used as a regular column in a visual. The following screenshot shows a matrix where the sales in Australia are included in two rows: Asia and Australia. Whenever you have a many-to-many cardinality relationship involved in a report, the measure is non additive and the Total shows a number that is not the sum of the visible rows – the total corresponds to the cumulative amount of the states selected considering each state only once.
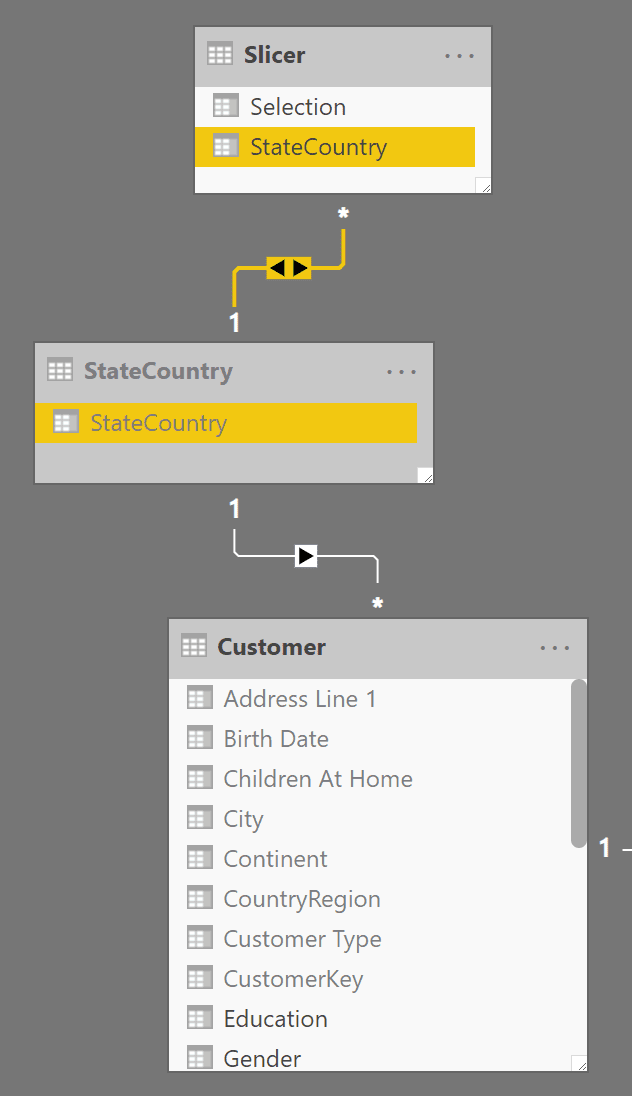
This solution should work well for models that have a cardinality of the relationship with a few hundred unique values. If the Slicer[StateCountry] column has thousands of unique values or more, then it is better to consider an approach based on physical strong relationships relying on an intermediate table created with the unique values of Slicer[StateCountry]. The following technique is also available in Analysis Services versions that do not support many-to-many cardinality in relationships. You can create the intermediate table StateCountry using the following calculated table definition:
StateCountry = ALLNOBLANKROW ( Slicer[StateCountry] ) |
COPYDAX CONVENTIONSCODE #3FORMAT CODE WITH

By enabling the bidirectional filter between the Slicer and StateCountry tables (which should be hidden in report view), you get the same result of a many-to-many cardinality relationship with improved performance.
The technique described in this article is useful whenever you want to show in a single column the values that are natively present in different columns of a table, providing a better user experience and a simplified user interface of the report.
Original post can be seen here