
by Carl Hoover, Senior Advisor, Elder Research

We observe a peculiar counter-fluctuation in a COVID-19 statistic — daily percent changes in deaths; it has a downward trend, but Tuesdays tend to see small increases.
COVID-19 death counts continue to increase. Figure 1a shows total U.S. deaths over the last 7 weeks along with the daily increase in deaths (dashed line). According to The COVID Tracking Project, between March 22nd and May 3rd reported deaths attributed to COVID-19 rose from 436 to a staggering 61,868.
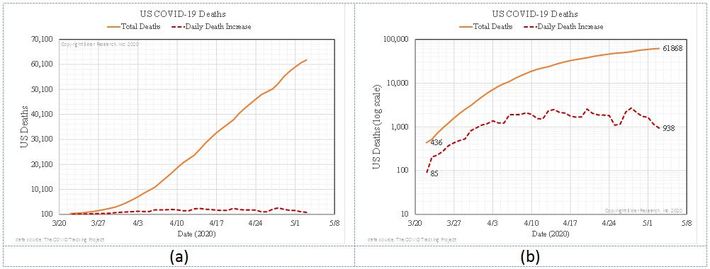 Figure 1.
Figure 1b depicts this data on a log scale. This view helps visualize daily increase in deaths relative to the total number of deaths. On a log scale it is easier to see that the growth rate begins to slow in more recent weeks. Fluctuation in the daily increase in deaths throughout April is apparent.
Wayne Folta, an Elder Research Lead Data Scientist, discovered that it is helpful to look at daily percent change in deaths. For deaths, daily percent change is the ratio of the single day increase in deaths over total deaths. Using the previous day’s total, the formula is:
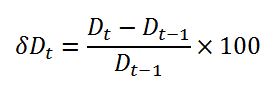
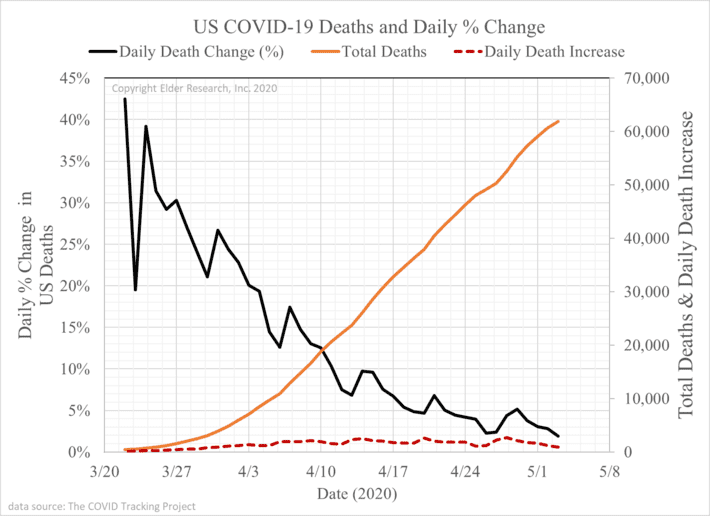 Figure 2.
Since late March, daily percent change in deaths attributed to COVID-19 (Figure 2) shows a general descent. This decline may seem counterintuitive given increasing total deaths, but it is a derivative or slope measure, so it is measuring the relative rate of increase. (Further, there is a very small built-in decline due to the growing denominator, total deaths). The important feature in this plot is the decline, but the surprising feature is its periodic “blips” or ripples, which are made evident by this new statistic.
Increases occur every 7 days, each Tuesday since March 22. This sawtooth pattern is more apparent when viewed on log scale (Figure 3), where red lines connect each Monday to Tuesday.
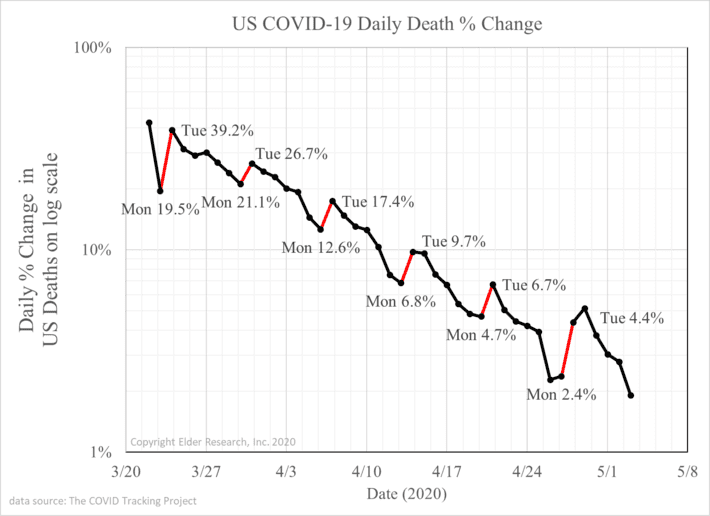 Figure 3.
It is clear from Figure 3 that there is (1) an exponential decreasing trend (which is linear in log space), (2) day-to-day noise, and (3) a weekly day-specific counter-trend. Each week, percent change in deaths declines steadily then jumps on Tuesday.
For example, for the week from Tuesday (4/21) to Monday (4/27) the daily deaths declined: 6.7%, 5.0%, 4.4%, 4.2%, 3.9%, 2.3%, 2.4%. A linear trend from this data predicts a decline of 1.4% for the next day, Tuesday. However, a two-week standard smoothing forecast (triple exponential) incorporating the 7-day pattern predicts a jump of 4.1%. That is much closer to the actual report for last Tuesday, which came in at a 4.4% increase in deaths, as shown in Figure 4.
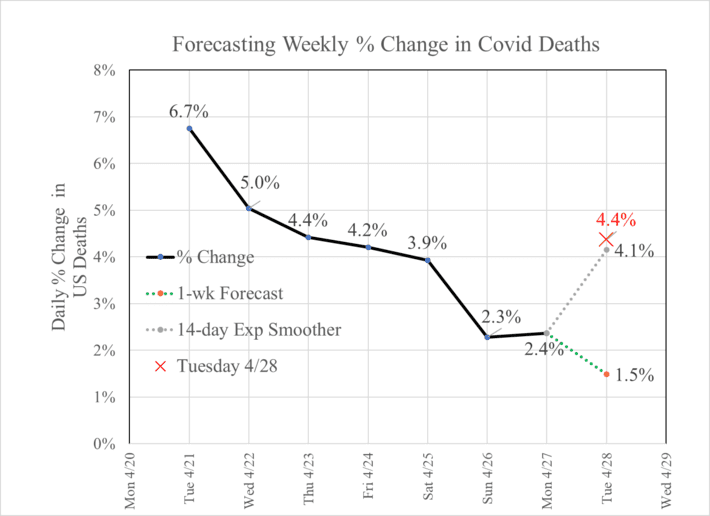 Figure 4.
We are not experts in COVID-19. Daily percent change is not a traditional feature used in COVID analyses, though it helped reveal this interesting pattern. We don’t know the cause of this Tuesday effect, or how long it will persist. We suspect it is a reporting latency artifact, akin to a weekend effect. The CDC indicates death reporting and aggregation is complicated by different reporting processes and reporting rates. They also state that COVID-19 deaths are manually coded by a person and that the process takes an average of 7 days.1 This may cause a left censoring condition in death reports.
Federal guidelines on relaxing COVID restrictions now establish state and regional gating criteria related to cases, symptoms, hospital treatment and testing standards2. “Downward trajectory…within a 14-day period” describes guidance for improvements in key indicators. Despite being widely reported, death counts or relative changes in death are not mentioned in the guidelines.
This snapshot of the complex world of COVID-19 tracking illuminates a small temporal data feature, just one of many such features that complicate the task of forecasting using raw data no matter what
modeling techniques are employed. This example is minor but illustrates how we must be careful about investing day-to-day data changes with too much meaning.
The author would like to thank all those who do the hard work of data aggregating and reporting.
[1] CDC: Understanding the Numbers: Provisional Death Counts and COVID-19
[2] White House Guidelines: https://www.whitehouse.gov/openingamerica/#guidelines