
With the onset of the COVID-19 outbreak, we look at the data and use a simple model inspired by China’s example to predict when the outbreak will abate in various countries.
Forecasts: https://www.codoma.tech/blog/covid19-forecast/ (updated daily)
The forecasts tell us that we, every human being, need to keep following the measures (social distancing, diligent heygenic habits, etc.) for around 70 days for the pandemic to abate.
Let’s stick together (metaphorically, remember social distancing) and stop the pandemic! Stay safe everyone!
Method
Since China was the first country hit, they took strong measures in response to the pandemic. Although the response was criticized in the beginning, most countries now followed suit. China therefore serves as a plausible reference to how the outbreak develops in various countries.
Examining the data, the number of new cases in China looked very similar to the known sigmoid function.
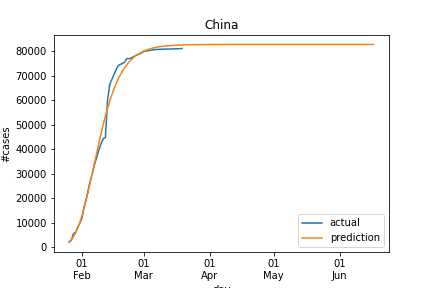
We follow an (admittedly simple) model: we fit a parameterized sigmoid function over the data from each country to predict:
- response date: the date when the country effectively started responding to the outbreak
- recession date: the date when for the first time the number of new cases is below 5 / day
Note: we created our own metrics here, please enlighten us if you have sounder ones.
More Details
(this section was added responding to Peter Schmidt’s good question)
Using China as a reference means that it is assumed all countries will eventually control the pandemic in a similar fashion to China, i.e. inflection points will come for certain (if they haven’t yet). The assumption is plausible (imo) because most countries now do pretty much the same as what China did two months ago.
Using this reasoning, we try to fit a sigmoid function with a shift in x (different countries start responding at different times) and 2 scaling factors in x and y. This allows calibrating the time span it takes a country to control the pandemic and the scale of infection. The params which gives best estimate of the new cases in the past n days are the one selected and used to extrapolate the number of new cases.
The optimal shift allows us to estimate when a country started responding to the disease. To intuitively evaluate the model, we looked 3 countries with known response date, it is not off by much:
China: actual = 23-jan, estimated = 26-jan (3 days off)
South Korea: actual = 25-feb, estimated = 20-feb (5 days off, people started self-isolating from 20-feb though)
Germany: actual = 11-mar, estimated = 9-mar (2 days off)
The model is obviously simple and susceptible to errors (especially for countries with low numbers), but it is somewhat useful given the limited information we have so far.