
Co-Integration in Time Series Analysis is when one data points is depended on other data points or follow the pattern. Example in capital markets Industry or sector leader company stock leads the direction and many small companies follows it. Example : Crude oil and Gasoline prices. Price of gasoline is dependent on Crude oil prices. Here Crude oil price always drives gasoline prices.
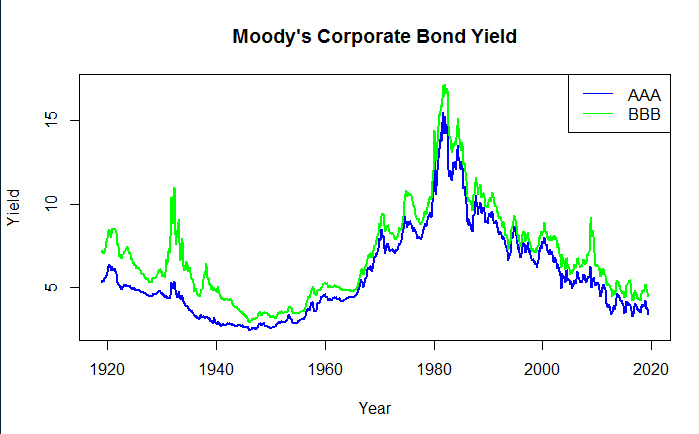
To analyze similar co-integration used Moody’s corporate AAA and BBB Bond Yields. Corporate bond BBB yields are co-integrated with yields of AAA.
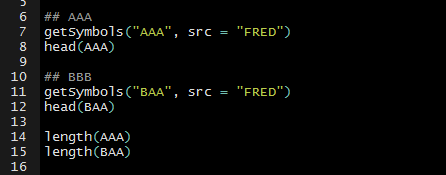
These Bond yield prices are downloaded from FRED economic data St. Louis using getSymbols() function from package quantmod. This downloaded data is from 1920 to 2019 about 100 years.
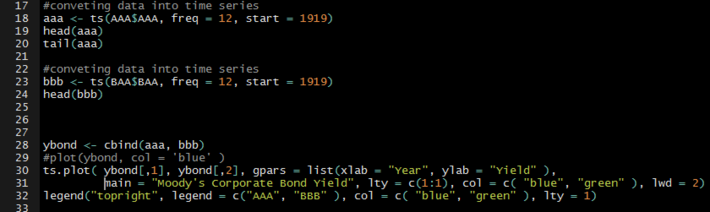
 After plotting it is clearly visible how bond yields are co-integrated . Before plotting downloaded data is converted to
time series using ts() function.
co-integration plot:
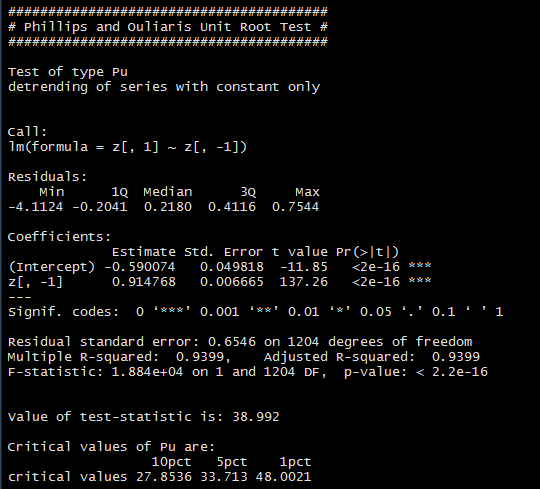
To check whether it is co-integrated or spurious Phillips and Ouliaris Unit Root Test is used with options both ‘pu’ and ‘pz’
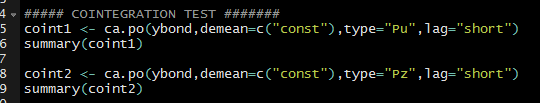
Output of the test to check the null hypothesis :
with option ‘pu’
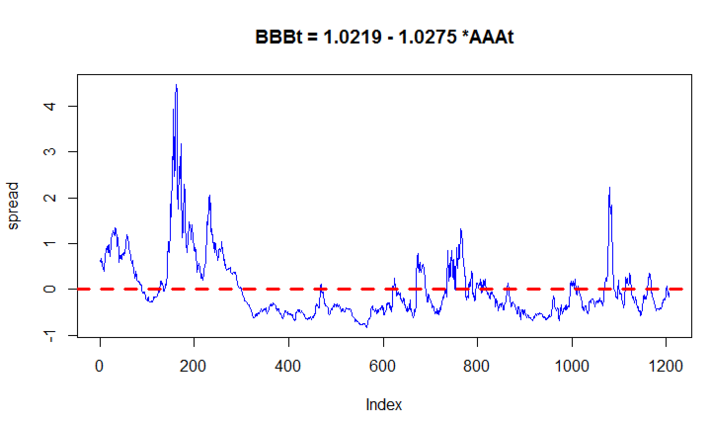
After checking for co-integration using pa test regressing BBB on AAA to derive the equation of spread, followed by plotting the spread. used lm() simple linear regression .
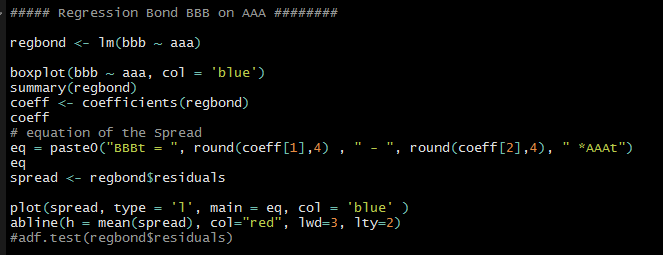
plotting the spread:
Identifying structural breaks: Structural breaks meaning permanent shift in mean. Basically business cycles, stock prices will change permanently as a result of big internal or external factors.
Used breakpoints() from strucchange package to identify number of breaks in the time series data .
Below is the complete code to check breaks and plot it.
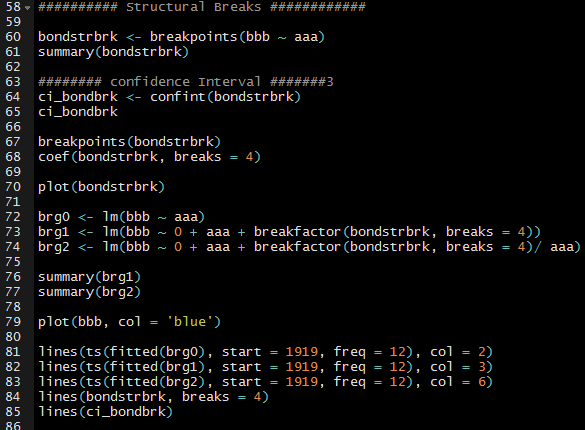
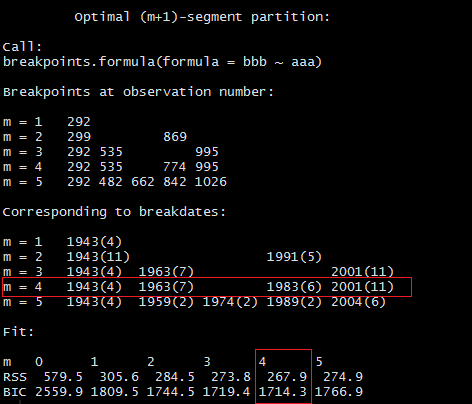
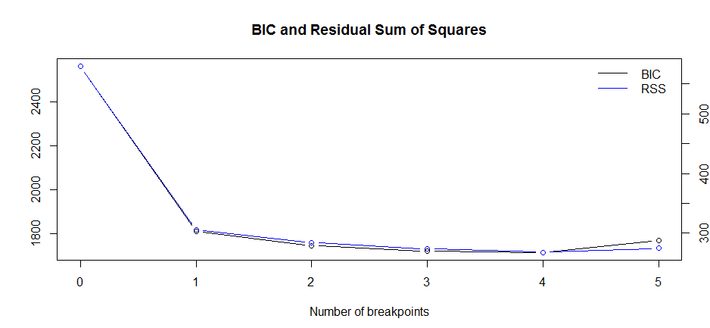
Based on the breakpoints() function coefficient there are 4 break points in this 100 years corporate bond yields. R function outputs different number of structural breaks ranging from 1 to 5 but we are suppose to pick one with lowest BIC value. In this example with 4 breaks got lowest BIC (1714.3) values compare to rest.
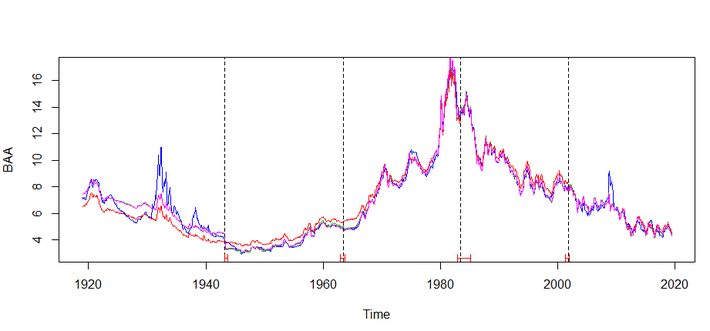
so, breaks happened in years 1943, 1963, 1983, 2001. If we check important events happened those years each of those years something world shocking significant events happened. It is very interesting how bond prices mean got shifted .
1943 – world war 2.
1963 – JFK died, Vietnam war was in peak
1983 – Bond marker crash
2001 – Dot Com Crash.
coefficients and BIC plot,
Each of the year range got different intercepts and coefficients.
Below plot showing fundamental shift in mean with structural breaks.
Conclusion: Every business , stock prices, market data, are bound to external and internal events. These events will change them for ever but it always challenging to identify is their any permanent change or not. So, using data points and breakpoints() in R is one cool way to identify if any structural breaks.