
This shinyapp is a live shiny/R web application (hosted on shinyapps.io) that implements simple sentiment analysis POC with R, to have an insight about the people’s sentiment about the smartphones from different brands released in India for a couple of weeks over a past time period, it was written a few years back (in 2014), for demonstration purpose, with the tweets collected (using the twitter APIs) over a few weeks at that point of time.
The web-application visualizes simple dictionary/word-count based sentiment-analysis scores for tweets (during Mar 17th – April 4th 2014) on smartphones in India in a few different ways. The web page has the following tabs each one for the following different purpose:
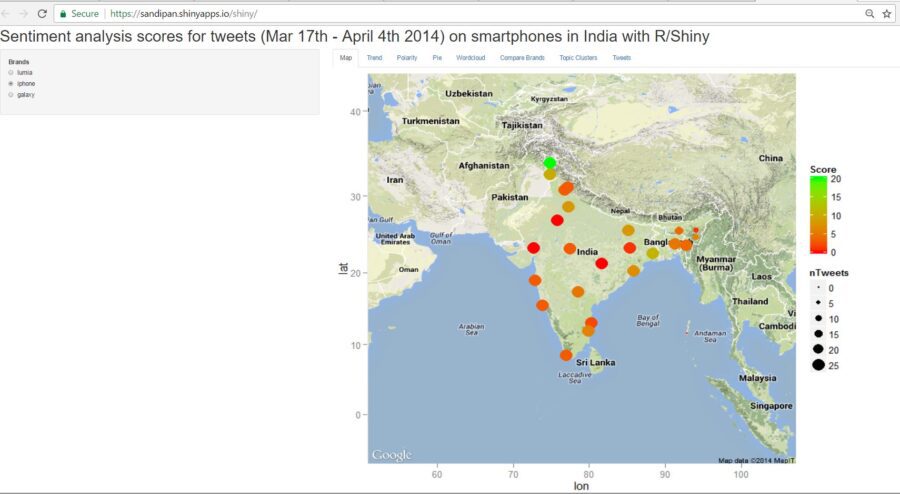
1. Map: Visualizes the overall sentiment scores for different smartphones brands across different locations in India, as shown in the figure below.
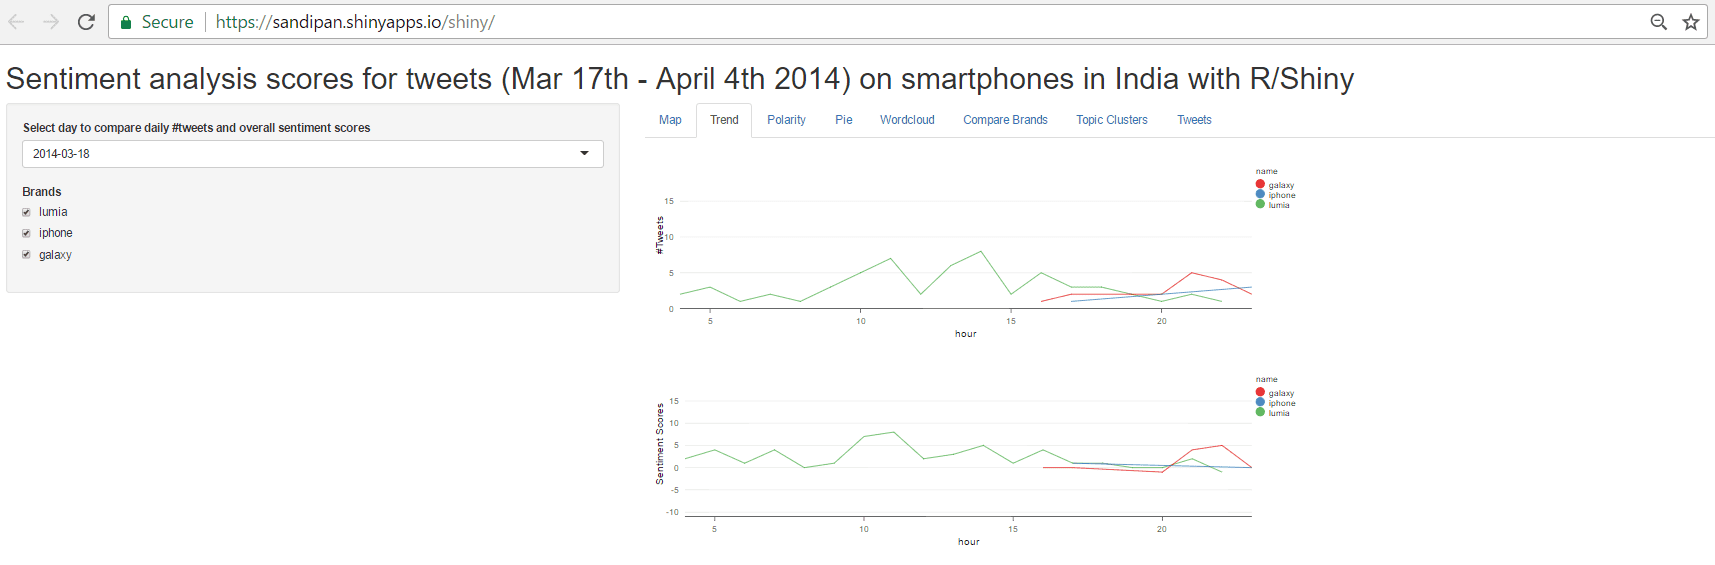
2. Trend: Visualizes the sentiment scores for different smartphones brands for at different times in a day for a selected day as time series, shown in the following figure.
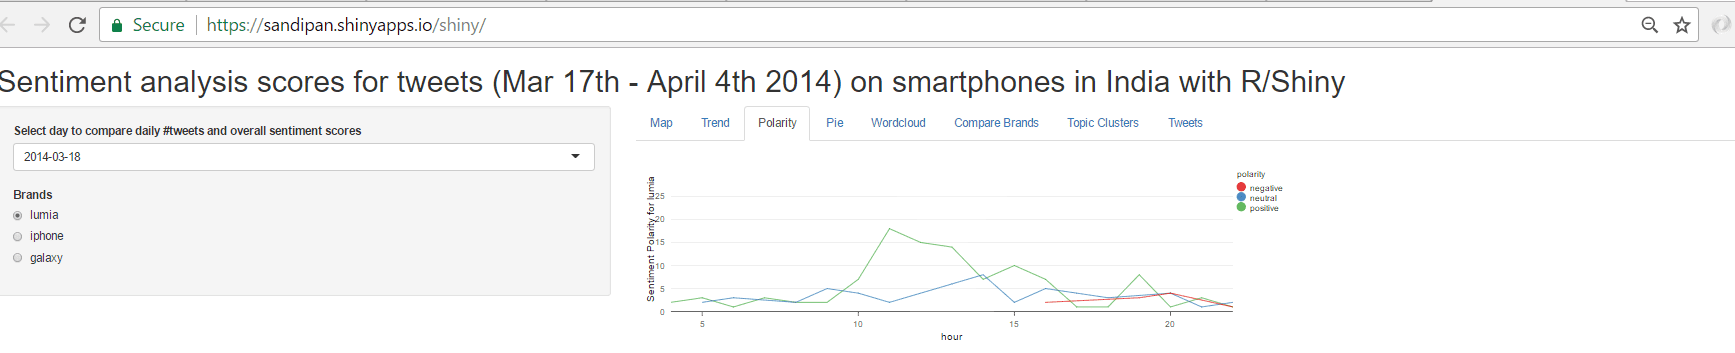
3. Polarity: Visualizes the polarity (+ve, -ve or neutral) of the tweets for different smartphone brands for at different times in a day for a selected day as time series, as shown below.
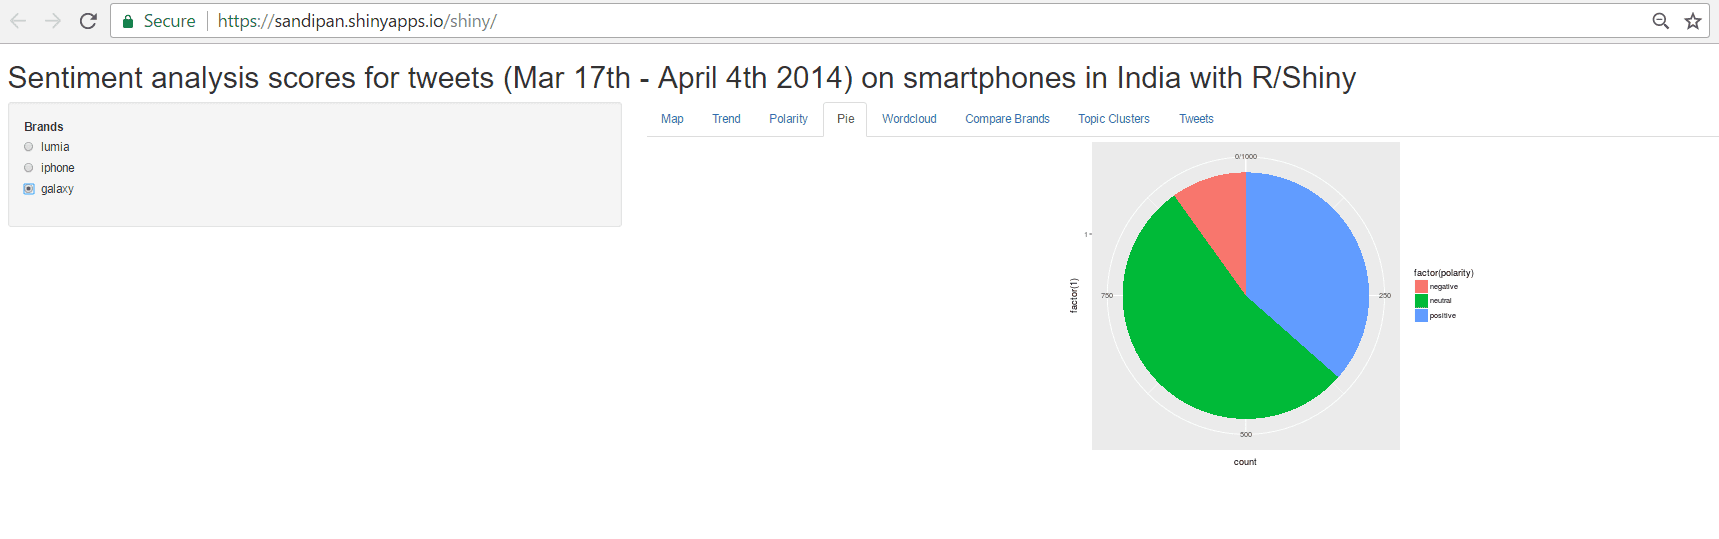
 4. Pie: Visualizes the pie chart for the overall tweet sentiment classes for different smartphone brands, shown in the next figure.
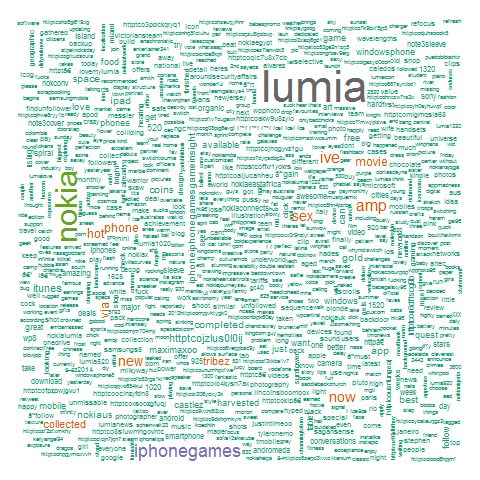
5. Wordcloud: Visualizes the word-cloud (font sizes proportional to the frequency of occurrences) for all the tweet texts (combined) for all the brands, shown in the following figure.
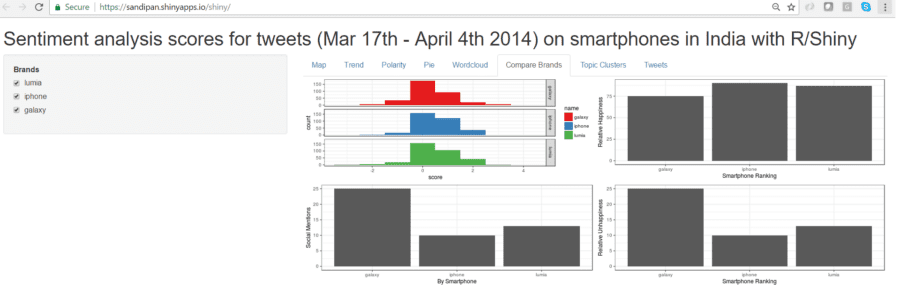
6. Compare Brands: Visualizes and compares different smartphone brands w.r.t. relative happiness, unhappiness and social mention, as shown in the following figure.
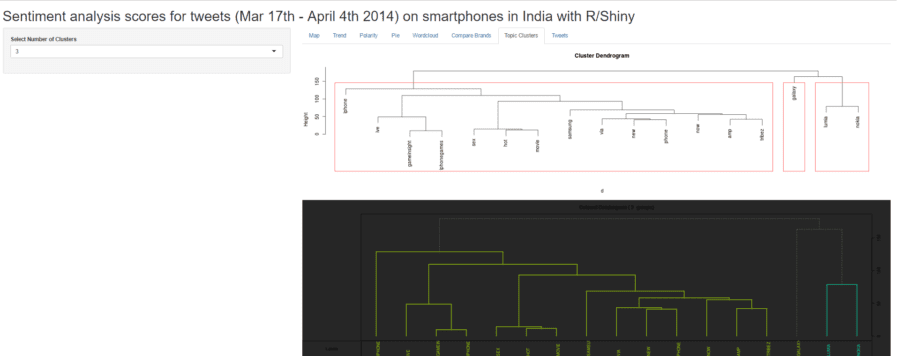
7. Topic Clusters: Visualizes and clusters the tweet texts using hierarchical clustering into a selected number of clusters, shown below.
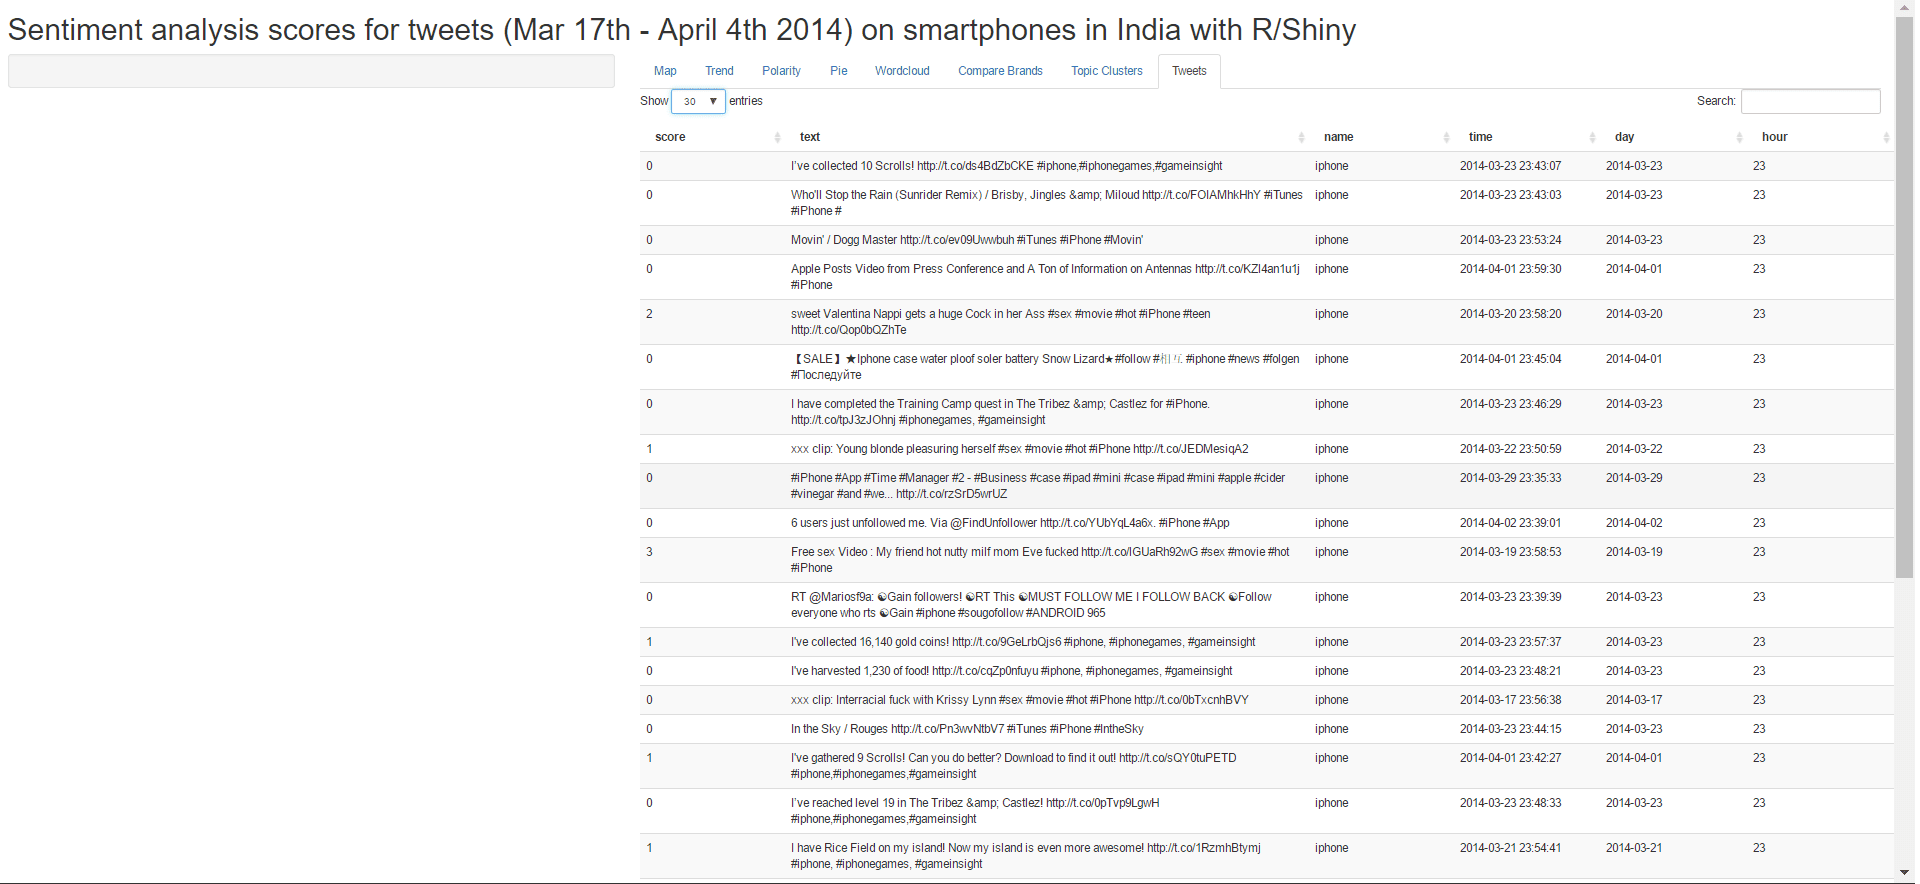
8. Tweets: Visualizes the raw data (tweets) used for the analysis in a tabular form, as shown in the next figure.
The shiny application can be found up and running here.