
Machine Learning is being applied to almost everything these days, and the results are immaculate. With the introduction of Machine Learning APIs, developers don’t have to train their own Machine Learning Algorithms, rather they can use these Machine Learning API’s to create most interesting applications.
Recently, I red an article in which Ben Hubl applied Microsoft Cognitive Service Emotions API to do emotions analysis of video of Hillary and Trumps last debate. I was amazed to see the accuracy of results, and the way graphs of emotions were shown per frame of the video.
This inspired me to do video emotions analysis of a Prime Minister Nawaz Sharif address to the nation after Panama Papers were published. I wanted to check what kind of emotions he showed during the speech, and the interesting thing is that emotions can be tracked for the whole video i.e. how the emotions change during the address.
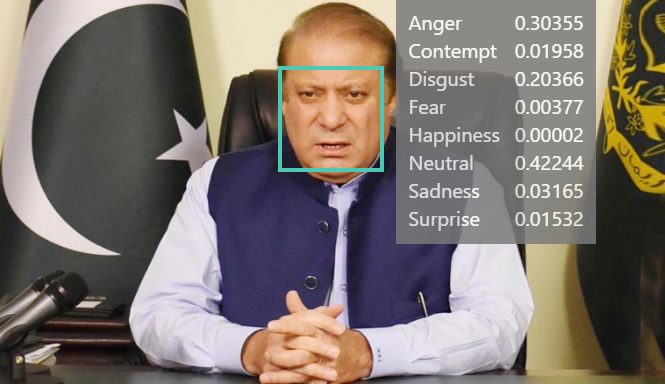
The picture above shows Emotions Analysis of a picture from the address. Microsoft Cognitive Services Emotions API gives percentages of what it thinks the emotion is based on the picture. In the above picture, the highest number is for Neutral with 0.42, followed by Anger and Disgust with 0.30 and 0.20 respectively.
This was emotions analysis of a picture from the Prime Minister’s address. Now coming to the emotions analysis of the whole video, it tracks the emotions during the whole video and provides a JSON(Java Script Object Notation) file which reports emotions per frame. I used Python to get the results from Microsoft Cognitive Video Emotions API, and then used Python’s matplotlib and R’s ggplot 2 to make visualizations. I will share the detailed code on my GitHub.
After getting the results for the whole video, I took mean of all the emotions and made a Bar Chart using Python’s matplotlib library. Here is the Bar Chart.
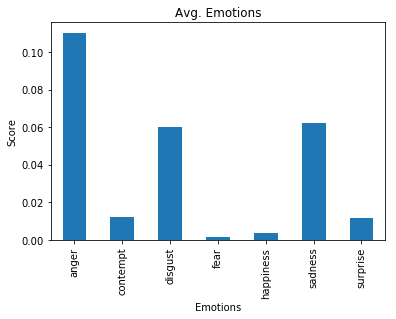
As expected, Anger has the highest mean, followed by sadness and disgust, which means that Prime Minister was quite angry during the speech. Surprise and contempt come on the lower side along with fear and happiness which are almost non existent emotions during the speech.
So emotions tell us a lot about what kind of speech it was, and the emotions which the Prime Minister went through during the speech. Histogram showed the average emotions during the speech, but we also have the emotion per frame, so we can visualize it on a time line i.e. Frame on x axis and the value of emotion of the y axis, and thereby see the change in emotions during the whole speech. Here is that graph which I made using ggplot 2 visualization library of R.
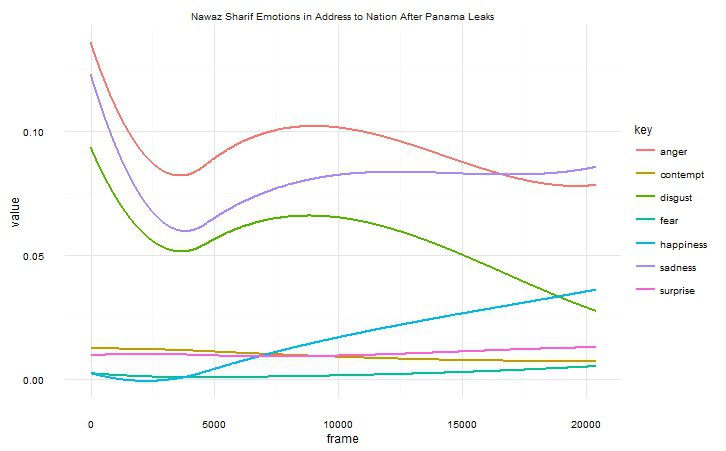
Here we can see that speech started with high anger, sadness and disgust, which then dipped and smoothed off. Prime Minister started with a low value of happiness, but it latter improved and at the end of the speech happiness took over disgust. The remaining emotions like fear, contempt and surprise remained low during the whole speech.
This kind of analysis can be supplemented with natural language processing i.e. concerned with the interactions between computers and human (natural) languages. We can check which words are associated with which emotions, which I intend to do in the future. Any guess which emotion of the Prime Minister could be associated with the word Imran? lol
I have used smoothed conditional means in the visualization above using gglpot 2 geom_smooth() using method = ‘loess’. This is for the more technical people, I will share the full code on my GitHub soon.
I wrote this article to show that we have entered a new era, and how Machine Learning is impacting every industry. The traditional print and digital media can use Machine Learning to get insights like the one I have shown from videos and pictures on a massive scale in real time.