
Image source: Statistical Aid: A School of statistics
Time series data
A time series data is a set of observation on the value that a variable takes of different time, such data may be collected at regular time intervals such as daily stock price, monthly money supply figures, annual GDP etc. Time series data have a natural temporal ordering. This makes time series analysis distinct from other common data analysis problems in which there is no natural order of the observation. In simple word we can say, the data which are collected in according to time is called time series data.
On the other hand, the data which are collected by observing many subject at the same point of time is called cross sectional data.
Time series analysis
A time series is a set of observations measured at time or space intervals arranged in chronological order. For instance, the yearly demand of a commodity, weekly prices of an item, food production in India from year to year, etc. Many economists and statisticians have defined time series in different words. Some of them are quoted below:
Wessel and Wellet: When quantitative data are arranged in the order of their occurrence, the resulting statistical series is called a time series.
Moris Hamburg: A time series is a set of statistical observations arranged in chronological order.
Patterson: A time series consists of statistical data which are collected, recorded or observed over successive increments.
Ya-Lun-Chou: A time series may be defined as a collection of magnitudes belonging to different time periods, of some variable or composite of variables such as production of steel, per capita income, gross national product, price of tobacco or index of industrial production.
Cecil H. Meyers: A time series may be defined as a sequence of repeated measurements of a variable made periodically through time.
Werner Z. Hirsch: A time series is a sequence of values of the same variate corresponding to successive points of time.
Spiegel: A time series is a set of observations taken at specified times, usually at equal intervals.
So, time series analysis is a statistical technique which deals with the time series data or trend.
Objectives of time series analysis
- To identify the pattern, trend and isolate the influencing factor or effects.
- To apply the idea obtained from analyzing the pattern of time series data for future planning and control.
Importance of time series analysis
- This is the most popular and so far the effective method for business forecasting.
- It helps in understanding the past behavior of economic process and in predicting the future.
- It helps in planning future operations.
- It helps in evaluating current achievement.
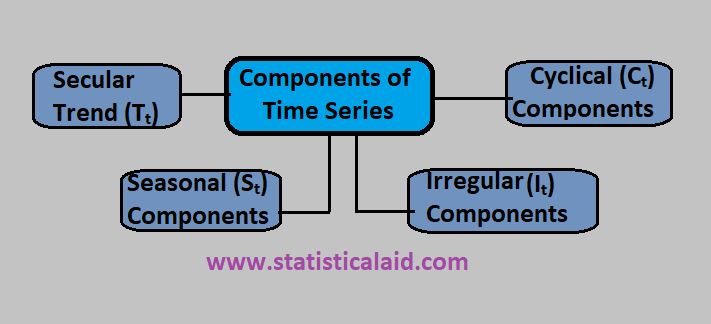
Components of time series
There are four important component or elements exist in time series analysis. They are-
Secular trend (Tt): Many time series met in practice exhibit a tendency of either growing or reducing fairly steadily over time. This tendency of time series data over a long period of time is called secular trend. Some series increase slowly, some fast, others decrease at varying rate and some remain constant for long period of time. There are several factors that affect trend in time series data such as population, technology, institution and culture of the study area etc.
Cyclical components (Ct): It generally refers the long term oscillations about a trend line. The cycler may or may not be periodic and the periodic of oscillation is usually more than 1 year. The cyclical movement are the so called business cycler representing intervals of prosperity, recession, depression, recovery and may last from seven to eleven years.
Seasonal components (St): Seasonal movement are periodic and regular in a time series with period less than 1 year. In a time series, seasonal movement refers to identical or almost identical patterns of movements during corresponding months of successive year. The vary name suggest that weather plays an important role in such movement.
Irregular components (It): Apart from the components, the time series contains another factor called irregular fluctuations which are purely random, erratic, unforeseen, unpredictable and are due to some irregular circumstance which are beyond the control of human hand but at the same time are a part of our system such as earth quakes, revolution, flood etc.
Measurement of trend components
To measure the four components of time series, we use the following methods-
- Graphic or free hand curve method.
- Semi-average method.
- Least square method.
- Moving average method.
Drawbacks of time series analysis
The drawbacks of the time series analysis can be summarized as follows-
- The conclusions drawn on the basis of time series analysis are not cent per cent true.
- Time series analysis is unable to fully adjust the influences affecting a time series like customs, climate, policy changes, etc.
- The complex forces affecting a time series existing at certain period may nut he having the same complex forces in future. Hence, the forecasts may not hold true.Source