
This article is chunk from one of my blog posts on Arima time series forecasting with Python It is a pretty extensive tutorial and until and unless you are not really interested in learning in and outs of about ARIMA time series forecasting don’t bother to click.
But I do wanted to share this list of 5 very useful metrics for a quick read about how one can evaluate forecasting errors while working with time series data. Here we also learn the situations when one measure fails and the other succeeds. In a hope that you like this chuck. I am being lazy and just copy pasting some of the interesting points from the original article with the hope to reach out to the reader of data science central with new and refreshed information.
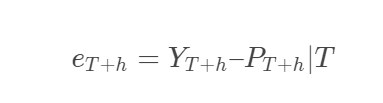
An error is a difference between the actual value and its forecast. Here residuals are different than the forecast error for two reasons. First residuals are calculated on the training dataset, whereas forecast errors are calculated on the test or validation dataset. Second, the forecast involves multiple steps, whereas residuals involve single step. Some of the metrics which we can use to summarise the forecasting errors are given below. But before that, let us look at the formula for calculating error. Here P represents the predicted/forecasted values.
- Mean Absolute Error(MAE) – The MAE is one of the most popular, easy to understand and compute metrics. Lower the value of the better is our forecast. The models which try to minimize MAE lead to forecast median.
- Root Mean Square Error(RMSE) – The RMSE is also among the popular methods used by statisticians to understand how good is forecast. The interpretation of the numbers is much more difficult in comparison to MAE. The models trying to minimize RMSE lead to a forecast of the mean.
Both MAE and RMSE are scale-dependent errors. This means that both errors and data are on the same scale. What does this mean to us? This means we cannot use these measures to compare the results of two different time series forecasts with different units.
- Mean Absolute Percentage Error(MAPE) – The MAPE has an advantage over MAE or RMSE as it is unit-free and thus is safe to use for comparing performances of time series forecast values with different units. The measure should not be used if you have a mix of fast and slow-moving products. The reason being it does not understand the difference between the fast-moving and slow-moving products. Typically, we would expect higher weights to be given to fast-moving products in comparison to slow-moving.
If you look at the formula closely, you will realize that if Y is zero, then the MAPE tends to become infinite or undefined(a typical problem of divide by zero). What does this mean? It means that we should not use MAPE if our time series have zero values. Another disadvantage that MAPE has is that it puts bigger penalties on negative errors than positive errors.
- Weighted Mean Absolute Percentage Error(WMAPE) – WMAPE is a highly useful and popular method for operational purposes. It provides more importance to fast-moving products and also provides a solution to divide by zero problems of MAPE.
- Symmetric Mean Absolute Percentage Error(SWAPE) – Another method to tackle “divide by zero problem” of MAPE, but the metric can have negative values, which makes it difficult to explain.
- Mean Absolute Scaled Errors(MASE) – All the above errors which we discussed are dependent on the scale and thus pose limitations when it comes to comparing the results of time series with different units. Citing these limitations, Hyndman & Koehler (2006) proposed an alternative metric called MASE. The formula for MASE is complicated, and thus we are skipping it for now.
Now that we have briefly touched upon some of the most popular methods of calculating forecasting errors let’s look at what packages and functions can be used in Python to generate these statistics.
# Calculating MAEmae = np.mean(np.abs(actual - ))# Calculating MAPE
mape = np.mean(np.abs(actual - forecast)/np.abs(actual))

 # Calculating WMAPE
 wmape = sum(np.abs(actual - forecast))/sum(actual)
Thank You for reading. Happy Learning!