
In this 5 Minute Analysis we’ll focus on accessing and understanding the Kaggle LA Restaurant & Market Health Data in real-time, exploring the data, and pivoting the data to report the top violators of the health code and their violations.
Dataset: Kaggle LA Restaurant & Market Health Data
This blog post explores and analyzes the data using PivotBillions, available freely on docker.
Goals
- Load the data to Pivot Billions and view its structure.
- Explore the data using Pivot Billions built-in features.
- Pivot the data to organize it by violator name and violation to see the worst violators and report our findings.
Steps
Load the Data and View its Structure
- Download the dataset from Kaggle.
- Unzip your downloaded data.
- Access the Pivot Billions URL for your machine.
- Click the Plus (+) icon on the top right hand side of the window.
- Select Drag & Drop.
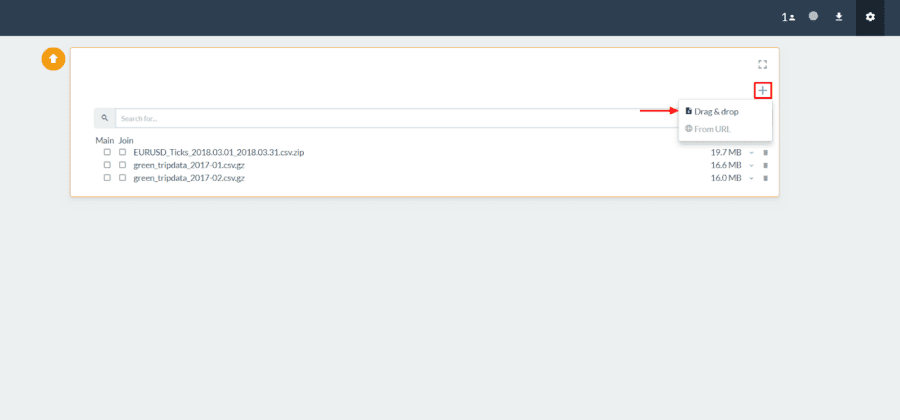
- Drag your downloaded “restaurant-and-market-health-violations.csv” file to the Drag & Drop box in Pivot Billions.
- Click the dropdown arrow
 to the right of the file in Pivot Billions to view the schema of the data and see a sample.
 - Then select the left checkbox next to the file and click Preview at the bottom of the screen.
 to the right of the file in Pivot Billions to view the schema of the data and see a sample.
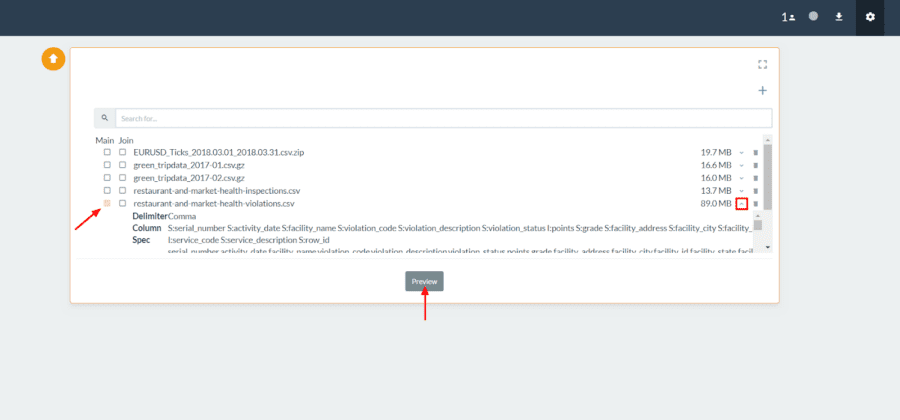
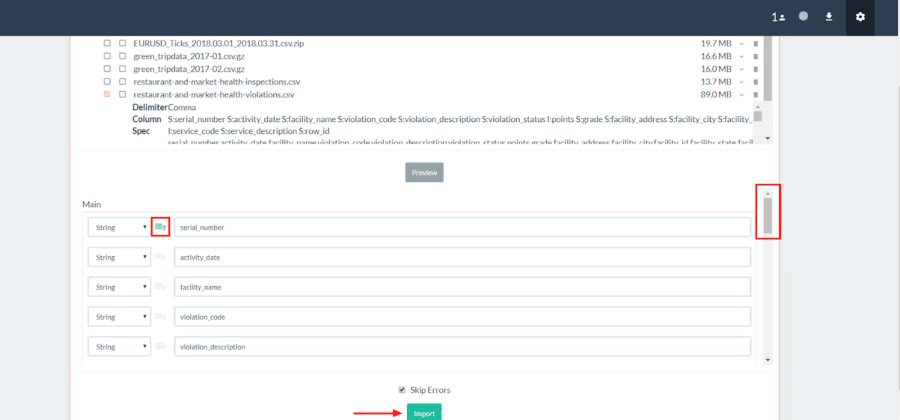
You can now see the columns and types of the dataset and modify them as you see fit. You can also view or change which column or columns are set as primary keys. When you are done viewing or modifying the data structure to be imported, click Import.
View and Explore the Data
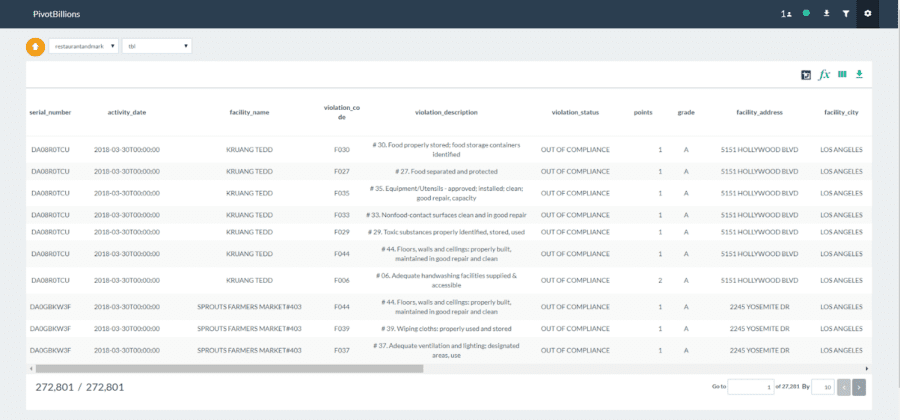
After the data has been quickly imported you can now see and access all 272,801 rows of the data.
By hovering over each column name you can sort the data by that column, view that column’s distribution over all of the data, filter by the data in that column, or rename that column. We’ll view the distribution of the data by the owner’s name.
Click on the second icon (distribution) in  for the owner_name column to see the distribution of total health code violations by owner.
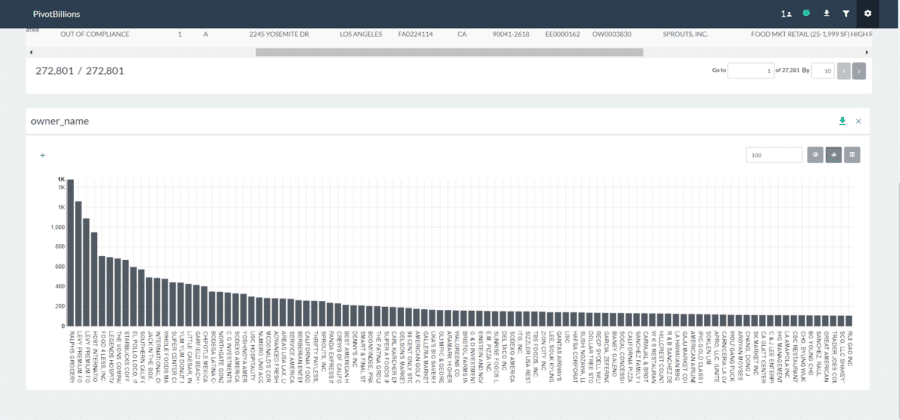
You can quickly see that Ralphs Grocery and Levy Premium have the highest number of violations. It is worth noting that Levy Premium actually has the highest total violations; however, its data is spread across two slightly different owner names.
Pivot and Report the Data
Now that we know which owners had the highest number of violations, we want to drill down into the data and see which health codes each owner violated. This is made extremely simple and fast using Pivot Billions.
- Click the Pivot icon in the the top right of your data table.
- Click the Plus (+) icon under Dimensions and select the “owner_name” column.
- Click the Plus (+) icon again and select the “violation_description” column.
- Click View to pivot your data.
 in the the top right of your data table.
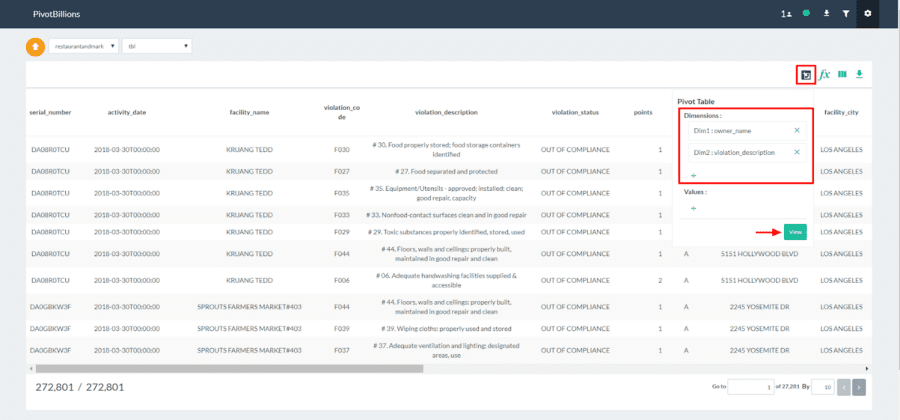
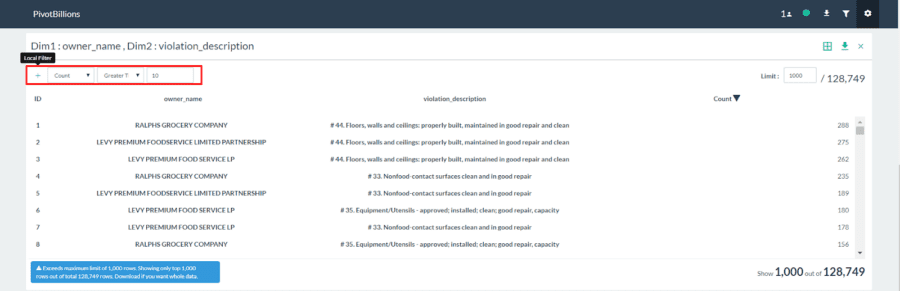
Pivot Billions now quickly reorganizes your data by owner name and violation description and provides counts of each unique combination’s occurrence in the data. You can sort by a column or filter the data. Here we’ll filter out the small violation counts since they are less significant and it makes the data more readable.
- In the top-left of the pivot widget, click the Plus (+) button.
- Select “Count” and “Greater Than”.
- Enter 10 and press enter.
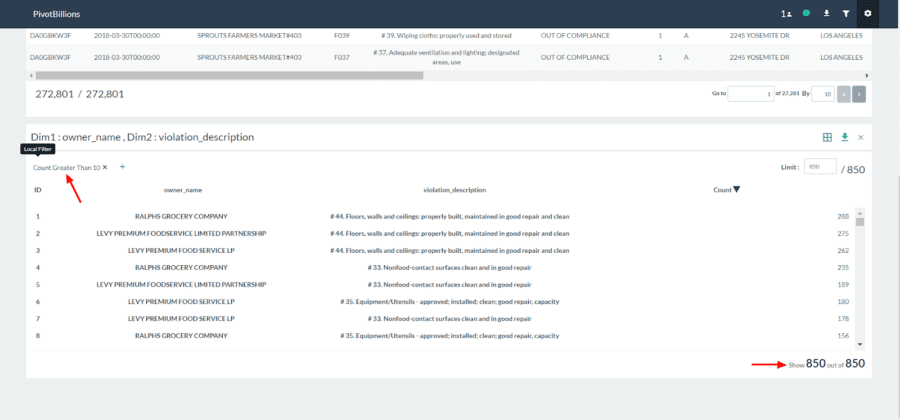
You can see the filter applied and the data reduced from 128,749 unique combinations to just the top 850 worst owner violations.
We’ll now interactively view the data.
- Click the Switch View Type icon in the top right of the pivot widget and select Pivot View.
- Drag the owner_name box to below the drop down selection box and the violation_description box to the right of the drop down selection box as shown below.
 icon in the top right of the pivot widget and select Pivot View.
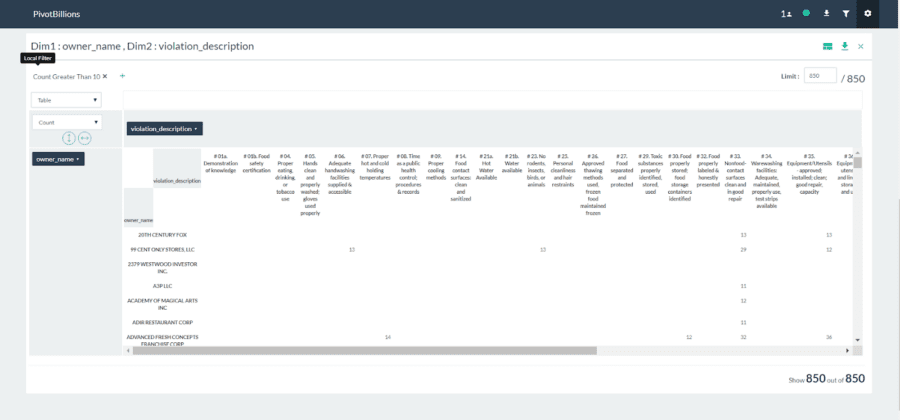
You can now easily sort the data to put the highest-count owner violation combinations in the top left.
- Click the arrow twice.
- Click the arrow twice.
 arrow twice.
 arrow twice.
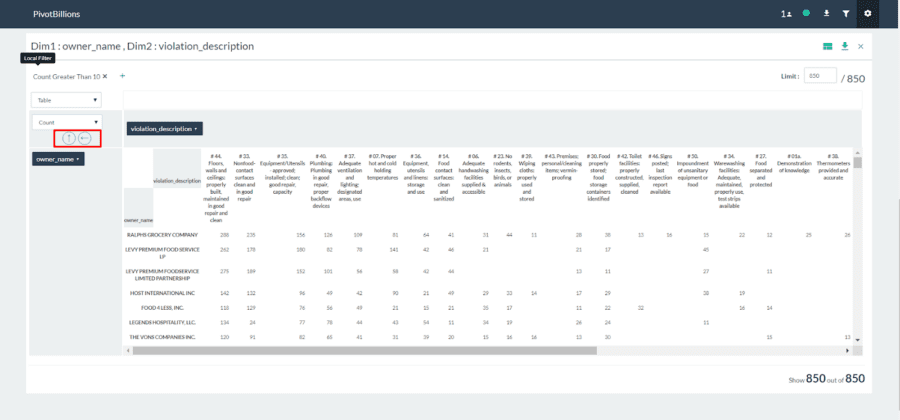
Now select the top-left drop box and change it from Table to Table Barchart to view a more visual representation of this data.
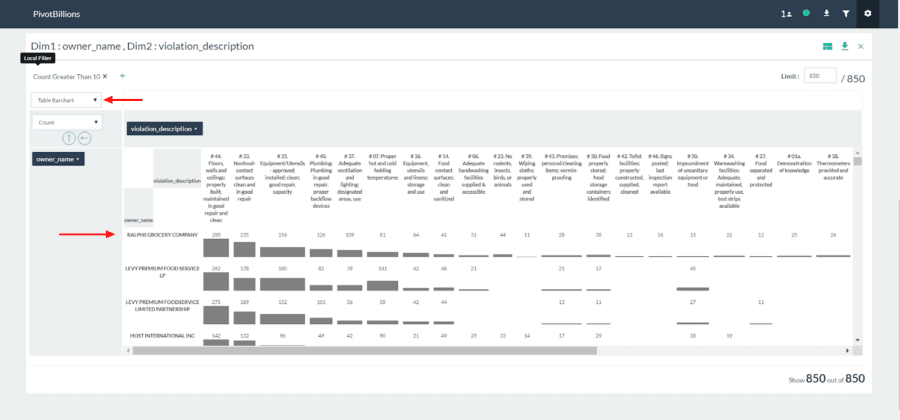
From our analysis it is clear that Ralphs Grocery Company is not only one of the worst offenders of health code violations, but it also has very high counts of a large number of different violations. Although Levy Premium has more total violations when the data for its two owner names are combined, the violations are slightly more consolidated.