
This article was posted by Patricia Hall and Varghese George on Amstatnews.
The ASA contacted the Statistical Consulting and Survey Center in the Augusta University Department of Biostatistics to help design and analyze the data for a survey of the association’s nonacademic members in the United States employed by business, industry, or government. Members were asked to report their annual base salary (in dollars) and instructed to include bonuses, incentives, or other forms of monetary reward. Salary was “annualized” for part-time employed respondents. All salary statistics are reported as full-time equivalents in dollars per year. Salary information, in the form of percentiles, is for a 12-month period.
The ASA sent the survey to members in their database of business, industry, and government statisticians. Of the 5,296 with valid email addresses who were invited to participate, 1,157 responded to the survey. Based on the responses received, it was determined that 126 individuals were not eligible to be included in the final analysis. Those ineligible were either employed in academia, unemployed, not employed as a statistician, retired, or reported that they did not meet the definition of a statistician. When adjusted for delivery failure, eligibility, and nonresponse, 1,031 (1,157 – 126) eligible responses were received from an adjusted universe of 5,170 eligible members (5,296 – 126) for an adjusted response rate of 20%.
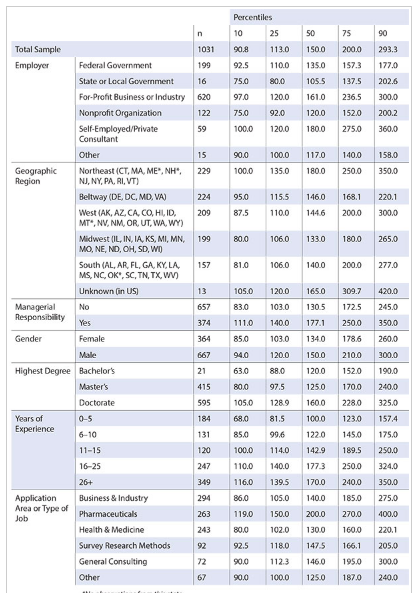
Table 1
Table 1 reports salary percentiles categorized by employer type, geographic region, managerial responsibility, gender, highest degree, years of experience, and application area or job type. Salary percentiles—cross-classified by years of experience, highest degree, and whether the respondent had managerial responsibility—are given in Table 2. Table 3 reports salary percentiles cross-classified by employer type and highest degree. Salary percentiles cross-classified by employer type, application area or job type, and highest degree are given in Table 4. Note that there were too few respondents with bachelor’s as their highest degree to be included in tables 2–4.
In addition to the salary tables presented here, the final report details the survey design, its administration and implementation, survey response rate, respondent characteristics, and various descriptive statistics for selected survey items. The survey questionnaire and email invitation/reminder message also are appended to the final report.
To see Table 1,2,3 & 4, click here.
Top DSC Resources
- Article: What is Data Science? 24 Fundamental Articles Answering This Question
- Article: Hitchhiker’s Guide to Data Science, Machine Learning, R, Python
- Tutorial: Data Science Cheat Sheet
- Tutorial: How to Become a Data Scientist – On Your Own
- Categories: Data Science – Machine Learning – AI – IoT – Deep Learning
- Tools: Hadoop – DataViZ – Python – R – SQL – Excel
- Techniques: Clustering – Regression – SVM – Neural Nets – Ensembles – Decision Trees
- Links: Cheat Sheets – Books – Events – Webinars – Tutorials – Training – News – Jobs
- Links: Announcements – Salary Surveys – Data Sets – Certification – RSS Feeds – About Us
- Newsletter: Sign-up – Past Editions – Members-Only Section – Content Search – For Bloggers
- DSC on: Ning – Twitter – LinkedIn – Facebook – GooglePlus
Follow us on Twitter: @DataScienceCtrl | @AnalyticBridge