
Introduction
Guys! Before getting started, just have a look at the below visualization and tell me, what are your observations. Yes, here we’re monitoring the performance of the model before moving into production. Why is this necessary for the ML space? Of course, this is a very important stage during model accuracy validation, whatever you can say. In this article, I am choosing one of the interesting techniques and discussing it in detail.
What are Model Performance and its necessity?
Machine learning model performance assessment is just like assessing the scores, how we used to evaluate our sores in high schools and colleges for meeting the eligibility criteria for getting the best courses or getting selected in the campus interviews for companies for the job and clearing cut-off scores for many more competition exams for getting selected. So apparently, the GOOD score recognizes the fact that the candidate is always good. The same is been expected in the machine learning model, and that should achieve the expected results in predictions/forecasting/calcification problem statements. Even in the ML world, the model has been trained in the context of data, model, and code.
What is the Accuracy of the Model and Performance?
Accuracy is the just number, for getting a better understanding of a prediction-based problem that corrects the predictions which are made by the model built by the team with the available number of records. So we need to train the model across different combinations of data.
ML Engineers and Business Team Agreement
As we are aware that there are multiple ways to evaluate the performance of the model. As a team always has the responsibility to build a generalized model and certain performance is expected in the production, at the same time we have to convince the customer, and stakeholders of the same and add the key business benefits based on the advisory committee by SME’s guidance to meet the goals.
As we are an ML engineering team, we must provide the performance of the model in the numeric range. Let’s say the performance of the model would be 85-90%. Sometimes the performance of the model in training and testing will not behave the same in production, in many cases, Overfitting or Underfitting will be experienced during the production environment.
Yes! Of course, this is really threatening to junior Data scientists and ML Engineers, but the challenge is one that requires improvising your technical capabilities, right? , So after many iterations and CI/CD involvement (MLOps), only the model will achieve the accuracy as expected and in a generalised mode. One step further, always we have to monitor the performance and apply the necessary changes to the model algorithm and code.
Will see how we could overcome this in a real-time, scenario.
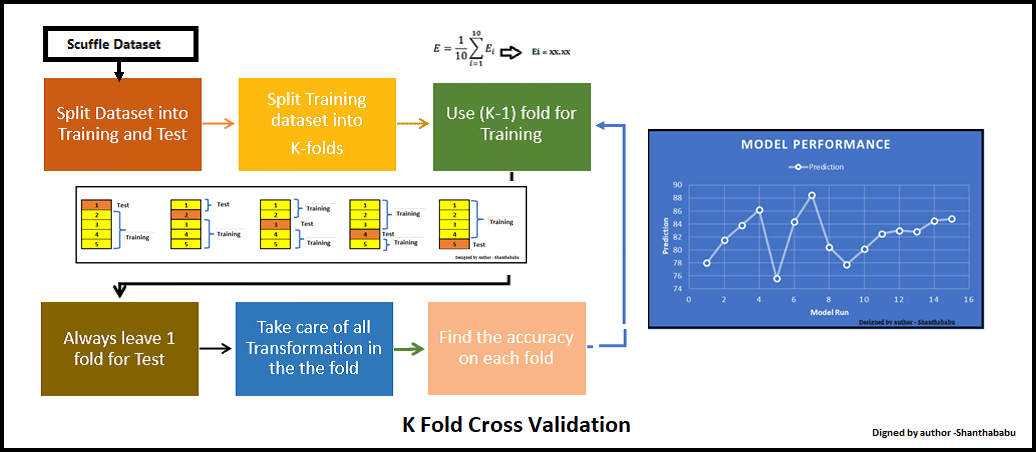
As I mentioned earlier the RANGE-Factor, we have different techniques to evaluate, in which Cross-Validation or K – Fold Cross Validation is best and easy to understand. This is simple in nature and involves a typical resampling technique, without any replacement in the data. And easily we could understand and visualise while implementing.
K-Fold
In each set (fold) training and the test would be performed precisely once during this entire process. It helps us to avoid overfitting. As we know when a model is trained using all of the data in a single shot and gives the best performance accuracy. Resisting this k-fold cross-validation helps us to build the model as a generalized one.
To achieve this K-Fold Cross Validation, we have to split the data set into three sets, Training, Testing, and Validation, with the challenge of the volume of the data.
Here Test and Train data set will support building model and hyperparameter assessments.
The model has been validated multiple times based on the value assigned as a parameter and which is called K and it should be an INTEGER.
To make it simple, based on the K value, the data set would be divided, and training/testing will be conducted in a sequence way equal to K time.
Life Cycle of K-Fold Cross-Validation
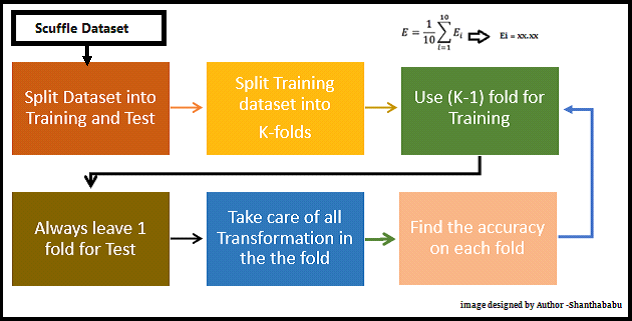
Image designed by the author
Let’s have a generalised K value. If K=5, it means, in the given dataset and we are splitting into 5 folds and running the Train and Test. During each run, one fold is considered for testing and the rest will be for training and moving on with iterations, the below pictorial representation would give you an idea of the flow of the fold-defined size.
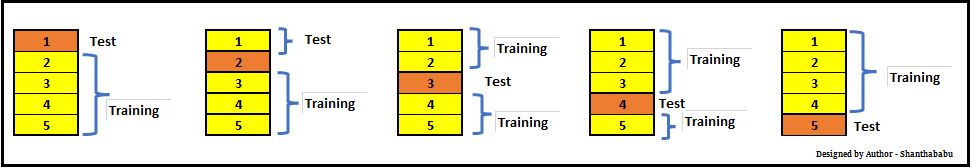
Image designed by the author
Which each data point is used, once in the hold-out set and K-1 in Training. So, during the full iteration at least once, one fold will be used for testing and the rest for training.
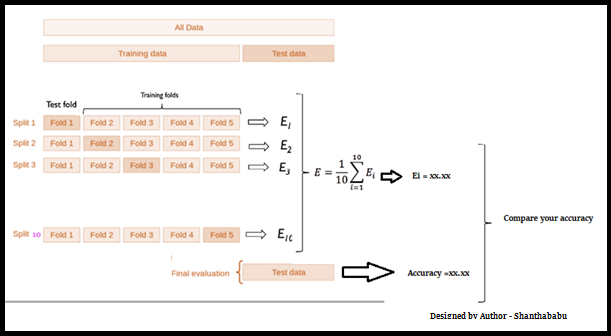
In the above set, 5- Testing 20 Training. In each iteration, we will get an accuracy score and have to sum them and find the mean. Here we can understand how the data is spread in a way of consistency and will make a conclusion about whether to for the production with this model (or) NOT.
Thumb Rules Associated with K Fold
Now, we will discuss a few thumb rules while playing with K – fold
- K should be always >= 2 and = to the number of records, (LOOCV)
- If 2 then just 2 iterations
- If K=No of records in the dataset, then 1 for testing and n- for training
- The optimized value for the K is 10 and used with the data of good size. (Commonly used)
- If the K value is too large, then this will lead to less variance across the training set and limit the model currency difference across the iterations.
- The number of folds is indirectly proportional to the size of the data set, which means, if the dataset size is too small, the number of folds can increase.
- Larger values of K eventually increase the running time of the cross-validation process.
Please remember K-Fold Cross Validation for the below purpose in the ML stream.
- Model selection
- Parameter tuning
- Feature selection
So far, we have discussed the K Fold and its way of implementation, let’s do some hands-on now.
Basic Example
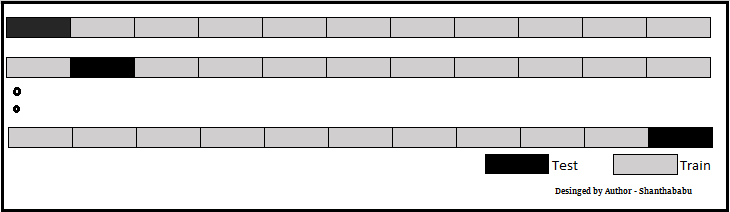
I am creating a simple array, defining the K size as 5 and splitting my array. Using the simple loop and printing the Train and Test portions. Here we could see clearly that the data points in TT buckets and Test data are unique in each cycle.
You can see the Train and Test array and how the array got split in every iteration.
Let’s do this with the dataset.
Model Selection using K-Fold
from sklearn.linear_model import LogisticRegression
from sklearn.svm import SVC
from sklearn.ensemble import RandomForestClassifier
import numpy as np
from sklearn.datasets import load_digits
import matplotlib.pyplot as plt
digits = load_digits()
from sklearn.model_selection import train_test_split
X_train, X_test, y_train, y_test = train_test_split(digits.data,digits.target,test_size=0.3)
imported required libraries and loaded digits (hand-written digits – open source), let’s apply a different algorithm.
Logistic Regression
I am using liblinear. This is the “Large Linear Classification” category. It uses a Coordinate-Descent Algorithm. This would minimize a multivariate function by resolving the univariate and its optimization problems during the loop.
lr = LogisticRegression(solver='liblinear',multi_class='ovr')
lr.fit(X_train, y_train)
lr.score(X_test, y_test)
Output
Score: 0.972222
SVC
Just using gamma is a parameter for non-linear perspective for hyperplanes. The value of the gamma tries to fit the training data set and uses 1/n_features.
svm = SVC(gamma='auto')
svm.fit(X_train, y_train)
svm.score(X_test, y_test)
Output
Score: 0.62037
Random Forest
For RFC, I am assigning estimators as 40.
rf = RandomForestClassifier(n_estimators=40)
rf.fit(X_train, y_train)
rf.score(X_test, y_test)
Output
Score: 0.96666
Scores from the above list of algorithms Logistic Regression and Random Forest are doing comparatively better than SVM.
Now will use the cross_val_score function and get the scores, passing different algorithms with the dataset and cv.
from sklearn.model_selection import cross_val_score
Set LogisticRegression, CV =3
score_lr=cross_val_score(LogisticRegression(solver='liblinear',multi_class='ovr'), digits.data, digits.target,cv=3)
print(score_lr)
print("Avg :",np.average(score_lr))
Output: for 3 fold we have 3 scores
[0.89482471 0.95325543 0.90984975]
Avg : 0.9193099610461881
Set SVM and CV=3
score_svm =cross_val_score(SVC(gamma=’auto’), digits.data, digits.target,cv=3)
print(score_svm)
print(“Avg :”,np.average(score_svm))
Output: Scores
[0.38063439 0.41068447 0.51252087]
Avg : 0.4346132442960489
Set Random Forest and CV=3
score_rf=cross_val_score(RandomForestClassifier(n_estimators=40),digits.data, digits.target,cv=3)
print(score_rf)
print(“Avg :”,np.average(score_rf))
Output: Scores
[0.92821369 0.95325543 0.92320534]
Avg : 0.9348914858096827
| Before K Fold apply | After K Fold applied (Avg) | |
| Logistic Regression | 97% | 91% |
| SVM | 62% | 43% |
| Random Forest | 96% | 93% |
Based on the above table, we will go with Random Forest for this dataset for production. But we have to monitor the model performance based on the data drift and as the business case changes, we have to revisit the model and redeploy.
Parameter Tuning Using K-Fold
Let us consider the RandomForestClassifier for this analysis, and n_estimators is our parameter for this case and CV is 10 (commonly used)
scores1 = cross_val_score(RandomForestClassifier(n_estimators=5),digits.data, digits.target, cv=10)
print(“Avg Score for Estimators=5 and CV=10 :”,np.average(scores1))
Output
Avg Score for Estimators=5 and CV=10 : 0.87369
scores2 = cross_val_score(RandomForestClassifier(n_estimators=20),digits.data, digits.target, cv=10)
print(“Avg Score for Estimators=20 and CV=10 :”,np.average(scores2))
Output
Avg Score for Estimators=20 and CV=10 : 0.93377
scores3 = cross_val_score(RandomForestClassifier(n_estimators=30),digits.data, digits.target, cv=10)
print(“Avg Score for Estimators=30 and CV=10 :”,np.average(scores3))
Output
Avg Score for Estimators=30 and CV=10 : 0.94879
scores4 = cross_val_score(RandomForestClassifier(n_estimators=40),digits.data, digits.target, cv=10)
print(“Avg Score for Estimators=40 and CV=10 :”,np.average(scores4))
Output
Avg Score for Estimators=40 and CV=10 : 0.94824
| scores1 | 87.36% |
| scores2 | 93.33% |
| scores3 | 94.87% |
| scores4 | 94.82% |
Based on the above observation, we will go with Estimators=30.
K-Fold in Visual form
Visual representation is always the best evidence for any data which is located across the axes.
from sklearn.model_selection import cross_val_score
knn = KNeighborsClassifier(n_neighbors=5)
scores = cross_val_score(knn, X, y, cv=10, scoring='accuracy')
print(scores.mean())
Output
0.9666666666666668
k_range = list(range(1, 25))
k_scores = []
for k in k_range:
    knn = KNeighborsClassifier(n_neighbors=k)
    scores = cross_val_score(knn, X, y, cv=10, scoring='accuracy')
    k_scores.append(scores.mean())
print(k_scores)
Output
[0.96, 0.95333, 0.96666, 0.96666, 0.966668, 0.96666, 0.966666, 0.966666, 0.97333, 0.96666, 0.96666, 0.97333, 0.9800, 0.97333, 0.97333, 0.97333, 0.97333, 0.98000, 0.9733333, 0.980000, 0.966666, 0.96666, 0.973333, 0.96, 0.96666, 0.96, 0.96666, 0.953333, 0.95333, 0.95333]
import matplotlib.pyplot as plt
%matplotlib inline
plt.plot(k_range, k_scores)
plt.xlabel('Value of K for KNN')
plt.ylabel('Cross-Validated-Accuracy')
Output: With a simple plot, X=> value of K and Y=> Accuracy for respective CV
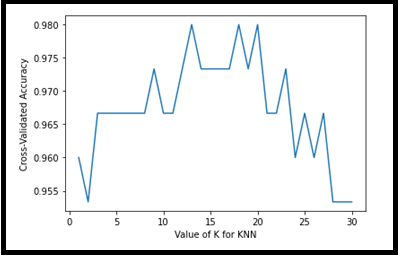
The above visual representation helps us to understand the accuracy is ~98%for K=12,18 and 19 for KNN.
Conclusion
Guys! so far, we have discussed various aspects of the K-Fold Cross Validation Technique and its importance in the Machine Learning model for production, and parameter selection with a classical example. I trust this article would help you all to understand this topic better. If you ask me if we have any disadvantages to this, my answer would be Yes! That is nothing but slow in execution than straightforward training and testing. In spite of this small drawback, K Fold cross-validation plays a critical role in the Machine Learning world.
Thanks for your time. Will connect with some interesting topics shortly. Bye! – Shanthababu.