
I recently completed teaching my “Big Data MBA: Thinking Like a Data Scientist (TLADS)” class for the spring semester at Iowa State University. I had 17 second-year MBA students, and their diligence, passion, and creativity were evident throughout the semester and especially in the final project presentations.
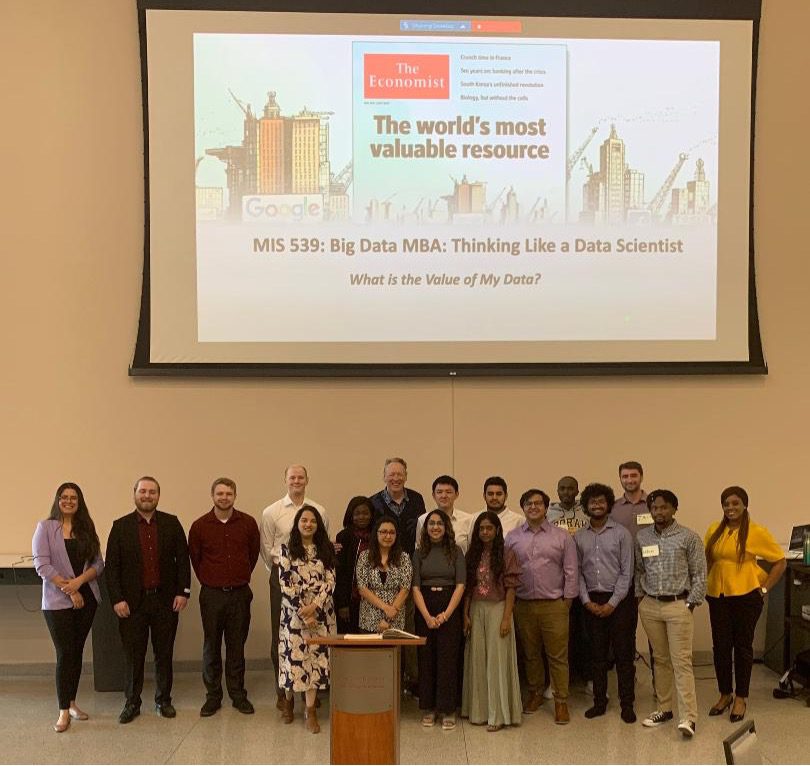
This class had no tests or mid-term exams where the students were asked to memorize and regurgitate knowledge readily accessible via my books, blogs, and ChatGPT. Instead, these students were graded as a team on their ability to collaborate in defining, synthesizing, and clearly and creatively presenting where and how to apply data science to deliver meaningful, relevant, and ethical business outcomes. Yea, it was like a real-world consulting project complete with tight deadlines, team interpersonal dynamics, and changes to project scope throughout the engagement.
We created five teams of 3 to 4 students. Each team picked a company and then researched that company to identify and understand the company’s key business initiatives. The teams then applied my “Thinking Like a Data Scientist” methodology over the next 13 weeks to determine where and how data and analytics could be applied to the company’s business initiative to drive meaningful, relevant, and ethical results. The companies and the business initiatives that they selected were:
- Lululemon: Double Men’s Sales while Maintaining Women’s Sales Growth
- Nike: Promote Sustainability Efforts to Capture Environmental-concerned Customers
- Nvidia: Increase Design Wins in Gaming Console Market
- Twitter: Improve personalized content matching to increase Twitter user engagement
- John Deere: Increase Hybrid/EV Tractor and Equipment Sales
As we progressed throughout the semester, new ideas were explored, resulting in modifications to existing TLADS design templates and even a new TLADS new design template. Yea, we all benefit when we are fearless in exploring, collaborating, and sharing.
TLADS Lesson #1: Decision Map Template to Identify Decision “Influencers”
In Step 2 of the TLADS process, we seek to understand key stakeholders’ decisions, desired outcomes, and the KPIs and metrics against outcomes’ effectiveness will be measured. The Persona template in Figure 1 allows us to walk in the shoes of our key stakeholders in better understanding their jobs, objectives, desired outcomes, and key decisions.
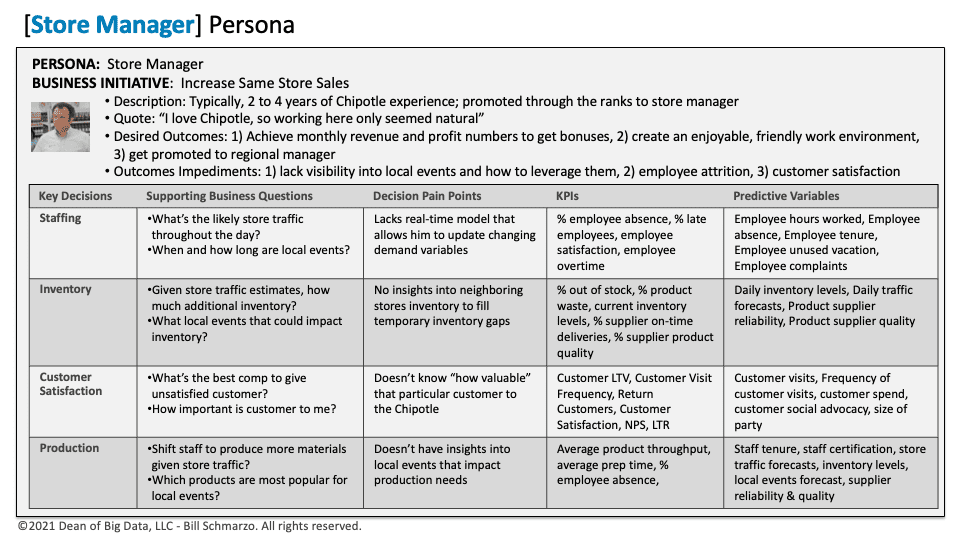
Figure 1: TLADS Persona Template
We discovered that we could complement the Persona template with a simple Decision Map to facilitate the brainstorming of the variables and metrics that might influence the Persona’s key decisions. These “influencers” became the starter set of variables and metrics (features) that we leveraged in TLADS Step 5 and Step 6 in defining the Analytic Scores that predict stakeholder behavioral or performance occurrence likelihood (Figure 2).
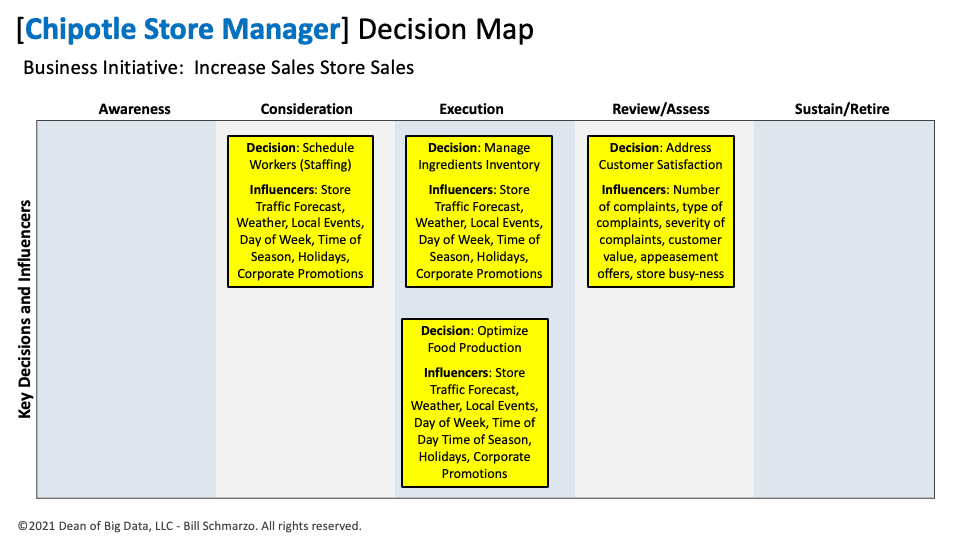
Figure 2: TLADS Stakeholder Decision Map
TLADS Lesson #2: Mapping Reusable Features to Analytic Scores
In Step 5 of the TLADS methodology, we identify the features we will use to create analytics scores supporting the stakeholders’ key decisions. Not surprisingly, features (such as weather, local demographics, traffic patterns, local events, and economic conditions) can be reused across multiple analytic scores. So, we created “Template 6.1: Use Case Feature-to-Score Mapping” to help us identify and map those features that can be reusable and managed by an organization’s Feature Store[1] (Figure 3).
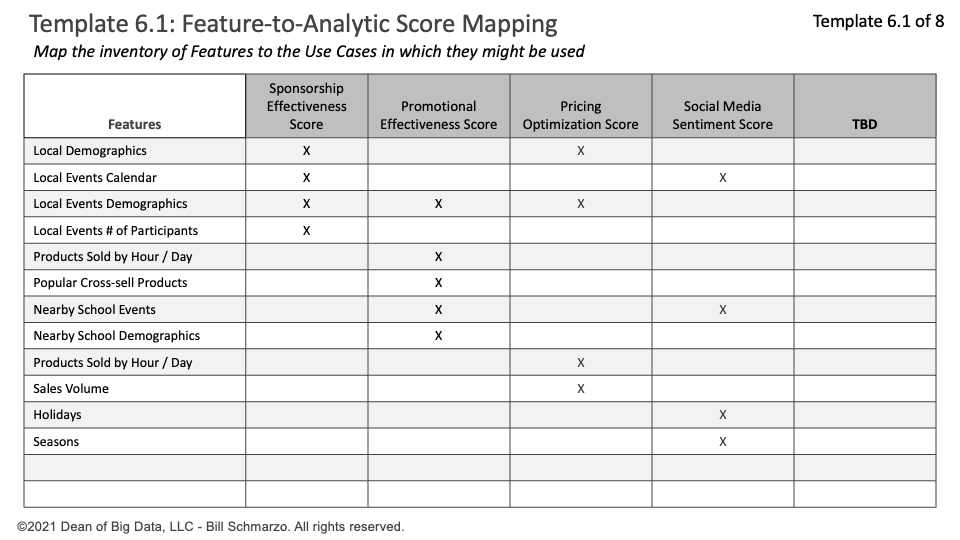
Figure 3: Feature-to-Analytic Score Mapping
In the blog “Features Part 1: Are Features the New Data?” I discussed why Features are a more valuable economic asset than data. It’s nice to have a TLADS design template to support that hypothesis.
TLADS Lesson #3: Recommendation Presentation and Model Feedback Template
And now a completely new TLADS design template that I have been considering for many months. I’ve been running these TLADS workshops for several years. And each time I get to the final step, the process feels incomplete, especially with organizations trying to build AI models that continuously learn and adapt. The TLADS methodology desperately needed a formal feedback process. Consequently, welcome to the new “Template 8: Recommendations Presentation and Feedback” template (Figure 4).
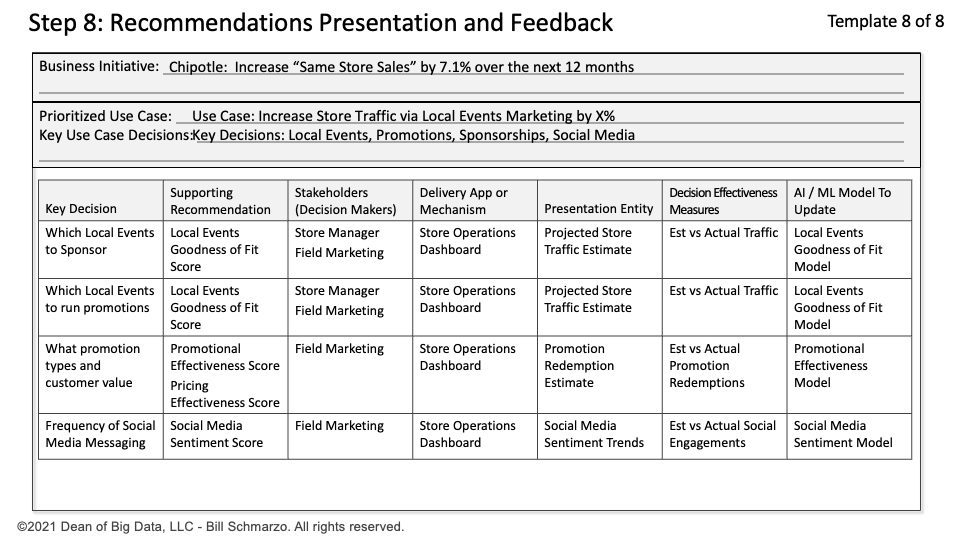
Figure 4: Step 8: Recommendations Presentation and Feedback Template
I am 99.9% confident that this form will morph as I get more feedback from running these TLADS workshops. And the fact that the methodology continues to learn and adapt means that this becomes the “Bill Schmarzo Full Employment Act” in ensuring that I have a role to play when AI technologies like ChatGPT and Google Bard are putting everyone else out of work (wait, I still have to work?).
Summary
Figure 5 represents the updated version 2 of my Thinking Like a Data Scientist (TLADS) methodology with the new Step 8. This is the first significant change to that methodology since I developed it eons ago. But the realities of a world where AI can create products, processes, and policies that can continuously learn and adapt necessitated the update—it’s a brave new world, baby.
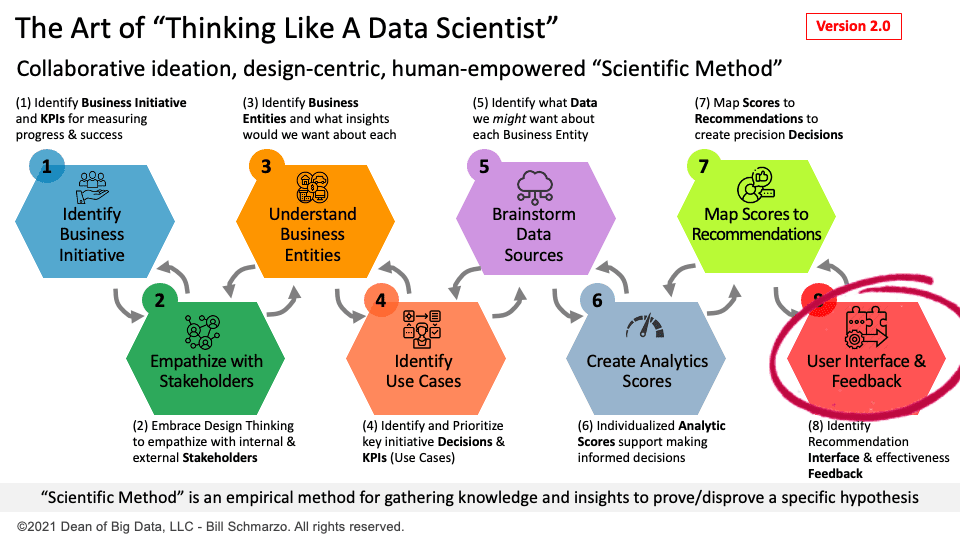
Figure 5: Updated Thinking Like a Data Scientist Methodology – Version 2.0
Special thanks to my students for being bold in exploring new concepts and techniques. Your energy and creativity were contagious. I can’t wait to do it again!
[1] A feature store is an emerging, ML-specific data system used to centralize storage, processing, and access to frequently used features, making them available for reuse in the development of future machine learning models.