
This blog post is not the end of my journey to integrate GenAI with my “Thinking Like a Data Scientist” (TLADS) methodology, but it is the last post on this leg of the journey. And the journey has been fascinating. I can’t wait to get this modified material in front of my students.
In part 1 of the series, I used GenAI (Bing AI) to enhance the first three steps in the TLADS methodology (Figure 1):
- TLADS Step #1: Identify Business Initiative. GenAI augmented my assessment of the targeted business initiative. That included identifying additional desired outcomes, benefits, impediments, failure risks, unintended consequences, and KPIs and metrics I needed to explore.
- TLADS Step #2: Empathize with Stakeholders. GenAI helped me understand my key internal and external stakeholders more thoroughly (through persona-based prompting). That included the business initiative’s importance to them, their key decisions, and the KPIs and metrics against which they would measure the success of the business initiative. Note: GenAI does not replace conducting stakeholder interviews, but it does prepare one for a more relevant and engaging interview.
- TLADS Step #3: Understand Business Entities. Finally, GenAI helped me identify, explore, and understand the business initiative’s key business entities. The business entity’s predicted behavioral and performance propensities are vital in optimizing the decisions that support our prioritized use cases.
At this point in the GenAI – TLADS integration process, I now have a very comprehensive prompt that sets the stage for part 2 of the series, where I used GenAI to enhance Steps 4 and 5 of the TLADS methodology:
- TLADS Step #4: Identify Use Cases. Because the business initiative detail is already entered via prompts into the GenAI tool, I could thoroughly explore the use cases that support the targeted business initiative. That included identifying and exploring the factors that impact use case “value” and “implementation feasibility” scores used in the use case prioritization process.
- TLADS Step #5: Brainstorm Scores & Features. This was my biggest aha in integrating GenAI with the TLADS methodology. I could leverage the detailed information about my targeted use case to identify and explore analytic scores and their supporting features.
In this final part of this series, I will explore the integration of GenAI (Bing AI) into the final steps of the TLADS process:
- TLADS Step #6: Explore Analytic Algorithms. We can build off the scores and features identified in Step #5 to explore the data science requirements more deeply. This is an entirely new step of the TLADS process, totally enabled by the GenAI tool.
- TLADS Step #7: Map Scores to Recommendations. We will use Bing to validate the linkage between analytic scores and the recommendations that will drive the precision decisions that optimize our prioritized use case.
- TLADS Step #8: Analytic Score Model Feedback. We will use Bing to ensure we have created a holistic feedback loop to build analytic scores that can continuously learn and adapt.
TLADS Step #6: Explore Analytic Algorithms
Nowhere did Bing AI impact the existing TLADS methodology more than this new step. I built on the learnings from Step 5 (Brainstorm Scores & Features) to explore what analytic algorithms I should use to create the analytic scores and why Bing felt these were the most relevant algorithms to generate that score (Figure 1).
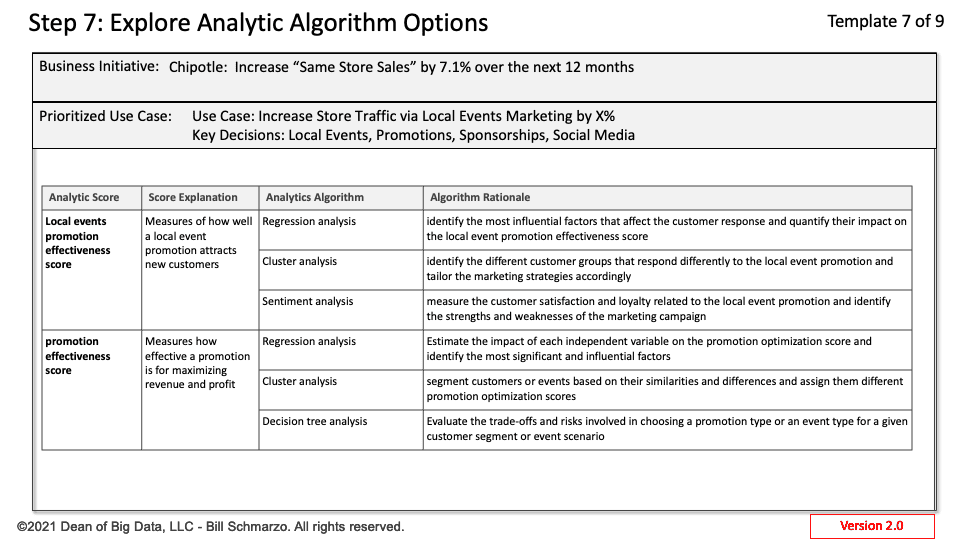
Figure 1: TLADS Step 6: Explore Analytic Algorithms
This presents an excellent opportunity to expand the understanding and familiarity of “Citizens of Data Science” with the different analytic algorithms, even if they never program machine learning (ML) models. By exposing them to the various algorithms and how they collaborate to generate an analytic score, their comfort level in working alongside the data science team to develop, design, and implement the analytic scores is greatly enhanced.
But wait, there is more. I not only leveraged GenAI to identify the algorithms to create a specific analytic score, but GenAI even wrote the pseudo-code for creating that score. See the Bing response for the pseudocode for creating the customer loyalty score using the k-means clustering algorithm.
=====
Bing Response: Pseudo code for creating the customer loyalty score using k-means clustering:
Step 1: Define the number of clusters, k, to be generated by the algorithm. For example, we can use two clusters: loyal and non-loyal customers.
k = 2
Step 2: Load the customer data from a CSV file.
customer_data = load_csv(“customer_data.csv”)
Step 3: Extract the features that affect the customer loyalty score. These are:
- Number of visits: The more visits a customer makes to Chipotle, the higher their loyalty score is.
- Average spend per visit: The more a customer spends per visit at Chipotle, the higher their loyalty score is.
- Time since last visit: The shorter the time since a customer’s last visit to Chipotle, the higher their loyalty score is.
- Length of visit: The longer a customer stays at Chipotle during their visit, the higher their loyalty score is.
- Number of referrals: The more referrals a customer makes to their friends and family to visit Chipotle, the higher their loyalty score is.
- Ratings and reviews: The more positive ratings and reviews a customer gives to Chipotle on online platforms, the higher their loyalty score is.
- Social media mentions and likes: The more mentions and likes a customer gives to Chipotle on social media platforms, the higher their loyalty score is.
features = [“number_of_visits”, “average_spend_per_visit”, “time_since_last_visit”, “length_of_visit”, “number_of_referrals”, “ratings_and_reviews”, “social_media_mentions_and_likes”]
Step 4: Normalize the features to have a common scale.
normalized_features = normalize(features)
Step 5: Apply the k-means clustering algorithm to the normalized features.
clusters = k_means(normalized_features, k)
Step 6: Assign each customer to a cluster based on their feature values.
for customer in customer_data:
cluster = assign_cluster(customer, clusters)
customer[“cluster”] = cluster
Step 7: Calculate the customer loyalty score for each customer based on their cluster. For example, we can assign a score of 1 to loyal customers and 0 to non-loyal customers.
For customer in customer_data:
if customer[“cluster”] == 0:
customer[“loyalty_score”] = 1
Else:
customer[“loyalty_score”] = 0
Step 8: Save the customer data with the loyalty score to a new CSV file.
save_csv(“customer_data_with_loyalty_score.csv”, customer_data)
=====
It’s incredible how much a non-data scientist can leverage GenAI to understand the algorithms and mechanics necessary to build an analytic score. However, it is unlikely that non-data scientists will be able to leverage GenAI tools for developing, deploying, and managing analytical models by themselves (data scientists can take a breath now). There are vital data science tasks that are outside the capabilities of GenAI, including:
- GenAI cannot perform data engineering tasks such as data preparation, integration, cleansing, wrangling, and munging. These tasks require specific knowledge of the data sources, formats, quality, and transformations needed for the analytic model.
- GenAI cannot write, test, and debug the actual code for the model. It only provides a high-level outline of the steps and logic in creating the model. You will still need to use a programming language to implement and run the pseudocode on your data.
TLADS Step #7: Map Scores to Recommendations
There were only a few new insights from integrating the GenAI tool into this step, as this step is the summary of the TLADS workflow – to map the Analytic Scores to the prescriptive Recommendations that drive the optimization of the Decisions (Figure 2).
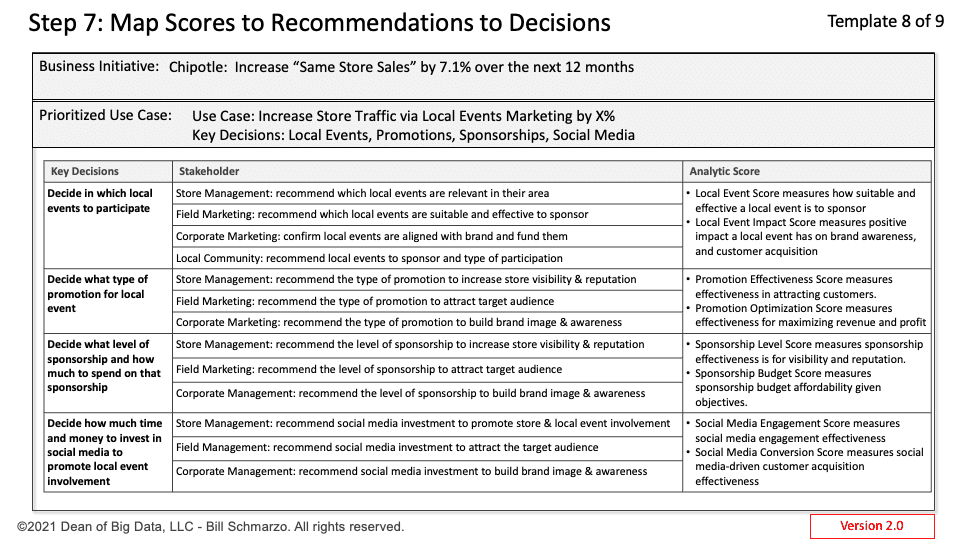
Figure 2: Map Analytic Scores to Stakeholder Recommendations to Decisions
One area where GenAI helped was in identifying the stakeholders that would need to apply the analytic scores to make recommendations. This is an area that one would undoubtedly want to verify in interviews.
Here are some of the prompts that I explored in Step 7:
- Bing Prompt: For each key decision, map the stakeholders who impact that decision, the recommendations that the stakeholder would need to make in support of that decision, and the analytic scores that the stakeholder would leverage to make recommendations.
- Bing prompt: For a specific use case, what are the potential linkages between the Business Entities that support that use case, and what might be the ramifications of those linkages?
- Bing Prompt: How do these linkages impact the information or data I want to capture on each Business Entity?
TLADS Step #8: Analytic Score Feedback
Step #8 is an entirely new step in the TLADS process. The additional time for this new step was created when we leveraged GenAI to combine previous Steps 5 and 6 to create a new Step #5: Brainstorm Scores & Features. What? I wasn’t going to give my students more time off! Time to expand our learning, baby!
After much exploration and testing, I decided to leverage our extra time to formalize the feedback loop that ensures that our analytic models continuously learn and adapt. I read some random book titled “The Economics of Data, Analytics, and Digital Transformation” that advocated for that (Figure 3).
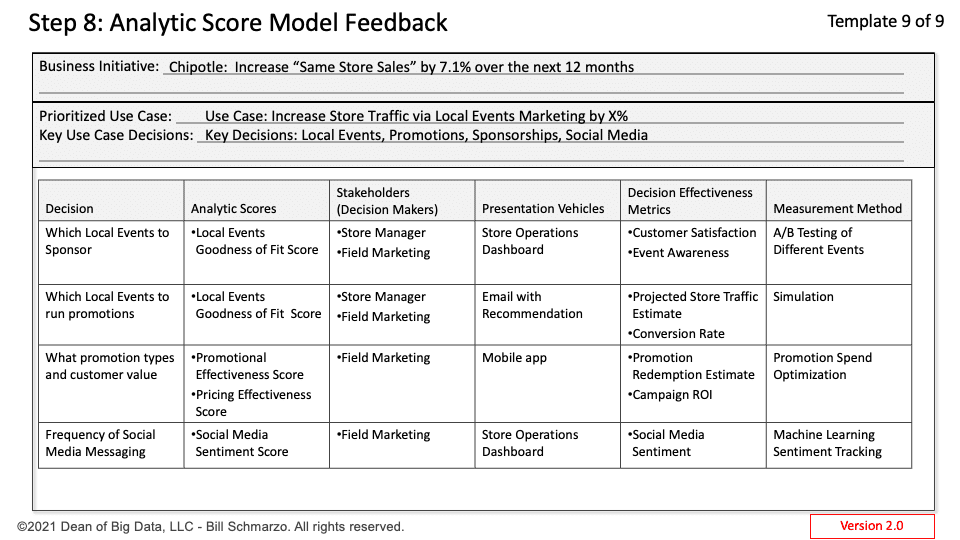
Figure 3: Analytic Score Model Feedback
Some of the prompts that I explored in Step 8 included:
- Bing Prompt: For each use case recommendation, can you determine what variables and metrics we should monitor to determine the analytic score and recommendation effectiveness,
- Bing Prompt: What are the best techniques or methods for feeding the decision effectiveness assessment information back to the respective AI / ML model that generated the analytic score and the recommendation?
- Bing Request: Given the decisions the key stakeholders are trying to make, what are the best KPIs and metrics for measuring the effectiveness of that score to improve decision effectiveness?
- Bing Request: What are the best methods for measuring that effectiveness and feeding the learnings from that effectiveness assessment back into the analytic algorithms that support the “Improve Local Events Marketing Effectiveness” analytic score?
Summary: Integrating GenAI + TLADS – Part 3
The integration of GenAI into my “Thinking Like a Data Scientist” process significantly impacted almost every step and supporting design canvas. This resulted in a more comprehensive understanding of the factors that drive the successful definition, design, development, and adoption of data and analytics to deliver more relevant, meaningful, responsible, and ethical outcomes (refer to Figure 4).
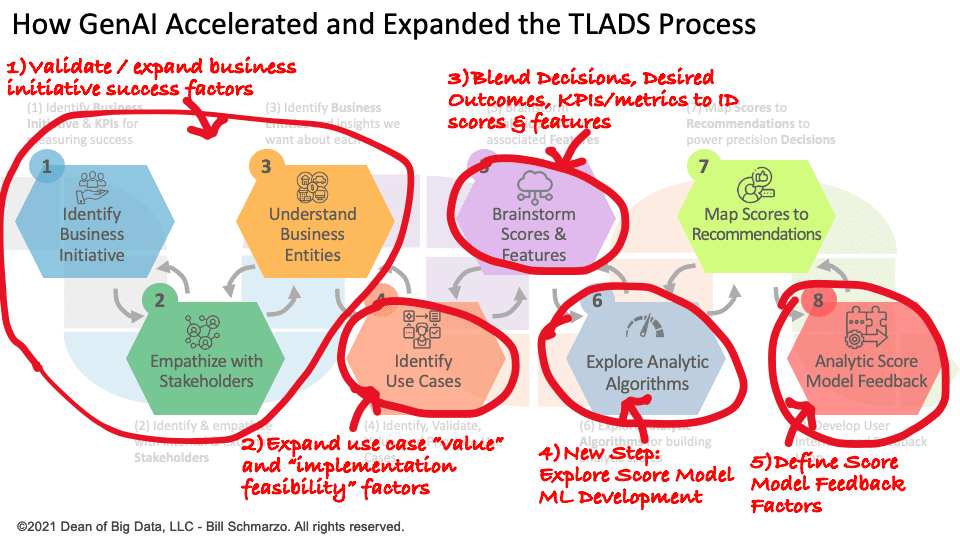
Figure 4: GenAI Impact on Thinking Like a Data Scientist Methodology
This experience was exhilarating. I literally pumped my fist and danced around as I discovered new areas where I could apply GenAI to enhance my TLADS methodology (much to the chagrin of the folks sitting around me at my Caribou Coffee shop).
And maybe the most exciting news is that I’m not done exploring, trying, failing, learning, and trying again as I seek to expand the integration of GenAI into my Thinking Like a Data Scientist methodology.
I hope my university and corporate students are ready to continue this journey together!