
While the comparison table in this article applies to a specific problem in FinTech, the conclusions are consistent with findings in other frameworks. There is no single method that outperforms all the other ones, for obvious reasons. To be the global winner means winning on all potential datasets. The immense majority of datasets are pure noise, for which performance is meaningless, and the winner randomly changes from one dataset to another. Yet, in real-life applications, each dataset comes with patterns or meaningful signal. There are strategies that on average, do better. The purpose of this article is to explore what works best. However the winning methods depend to a large extent on the type of problem being studied. It is easier to to rule out methods that are consistently underperforming.
The conclusions here are based on the book “Big Data and AI Strategies: Machine Learning and Alternative Data”, published by JP Morgan Chase and available (for free) here. In particular, Table 1 is a re-organized version of the one shown page 117 in that book.
Overview
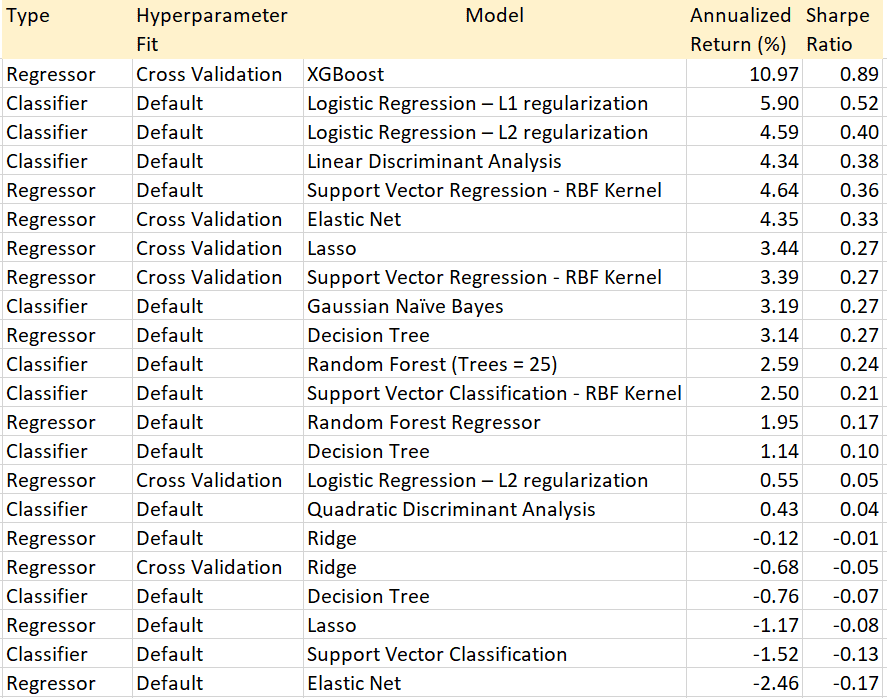
The 22 methods listed in Table 1 were used in daily trading of energy stocks (more precisely, indexes combining many stocks) over a long period of time. The methods are ranked according to the Sharpe ratio. This metric measures the performance of an investment portfolio compared to a risk-free asset, after adjusting for its risk. It is defined as the difference between the returns of the investment and the risk-free return, divided by the standard deviation of the investment returns.
I slightly re-ordered the original table, so that methods with identical Sharpe are sorted according to annualized return. It would be useful to add a robustness metric and comparison with a base model, in addition to the Sharpe ratio. In FinTech, great performance can come from spectacular results concentrated in a few short time periods, followed by abysmal performance but with an overall positive outcome as gains outweigh losses. Or it can come from more modest but consistent gains. The latter is preferable due to presumed sustainability, even if overall performance over a 10-year time period is lower.
Terminology
For those who are not familiar with all the terms in the table, I provide a short summary. The two types of methods are:
- Regressor, for regression: logistic, linear including Lasso and Ridge, or based on decision trees or support vector machines. Elastic net is a regression method with constraints on the regression coefficients to avoid over-fitting. It offers the best of Lasso and ridge regression.
- Classifier means supervised classification. Linear discriminant analysis is a rudimentary method that tries to separate clusters using hyperplanes. Quadratic discriminant analysis is a generalization using quadratic forms (second degree polynomials). Naïve Bayes is also a basic algorithm, but surprisingly efficient for problems such as fraud or spam detection.
L2 regularization is the classic criterion based on minimizing sums of squares. To the contrary, L1 minimizes the sum of absolute values: it is less sensitive to outliers. XGBoost is an ensemble method blending multiple decision trees. It combines the advantages of each decision tree taken separately. Note that logistic regression can be used both for supervised classification or regression.
Finally, “default” means using the default hyperparameter values. Cross-validation determines optimum values by testing outside the training set, but could result in over-fitting.
Findings
Elastic net is a type of constrained regression combining the benefits of ridge and Lasso regression. It is not surprising that it works better than both ridge and Lasso when using cross-validation. However, without cross-validation, it is the worst performer. As expected, XGBoost is the best performer.
Logistic regression does well as a classifier, but not so well as a regression technique. Not surprisingly the L1 version does better than L2. It is surprising to see support vector classification underperforming. However, support vector regression (SVM) does well, although it exhibits higher volatility. The fact that linear discriminant analysis — a rudimentary classifier — is in the top 5 and above SVM is surprising and suspicious, though part of it is because of lower volatility, and thus better Sharpe ratio. It is even more surprising that quadratic discriminant analysis (a generalization) is doing a lot worse than the linear version. Naïve Bayes is rudimentary, yet outperforms many more sophisticated techniques. It does not surprise me. Most likely, few methods among the 22 beat the “buy-and-hold” base strategy, since the annualized return rapidly drops to below 4%.
For those interested, I developed an alternative method to XGBoost, simpler yet blending with a generic logistic regression, rather than decision trees alone. The generic logistic regression (based on arbitrary distributions rather than the logistic one) and the simplified XGBoost algorithm, are described in my article “Machine Learning Cloud Regression: The Swiss Army Knife of Optimization”, available here.
About the Author

Vincent Granville is a pioneering data scientist and machine learning expert, founder of MLTechniques.com and co-founder of Data Science Central (acquired by TechTarget in 2020), former VC-funded executive, author and patent owner. Vincent’s past corporate experience includes Visa, Wells Fargo, eBay, NBC, Microsoft, CNET, InfoSpace. Vincent is also a former post-doc at Cambridge University, and the National Institute of Statistical Sciences (NISS).
Vincent published in Journal of Number Theory, Journal of the Royal Statistical Society (Series B), and IEEE Transactions on Pattern Analysis and Machine Intelligence. He is also the author of “Intuitive Machine Learning and Explainable AI”, available here. He lives in Washington state, and enjoys doing research on stochastic processes, dynamical systems, experimental math and probabilistic number theory.