
Every now and then, a conversation with my kids goes off the rails. And this was one of those conversations. We tend to have unusual conversations ranging from “Is Big Foot from outer space (like Predator)?” to “If man evolved from monkeys, then why are there still monkeys?”
And here is our latest conversation: Is God an economist?
Many of the lessons in the Bible about fairness and equality and justice and generosity are really economic lessons; lessons about the creation and distribution of a more holistic definition of “value”. And the key to any economics discussion is understanding how one defines and measures value creation effectiveness.
For example, a Massachusetts study shows the value potential of a fairness program called “meals for all students”. Massachusetts spends $2.4B annually on student mental health issues, diabetes, obesity, and cognitive development issues. Implementing “School Meals for All” would cost $100-120M annually, an investment that pays 10x dividends in improved health and education outcomes while creating society-contributing humans (Figure 1).
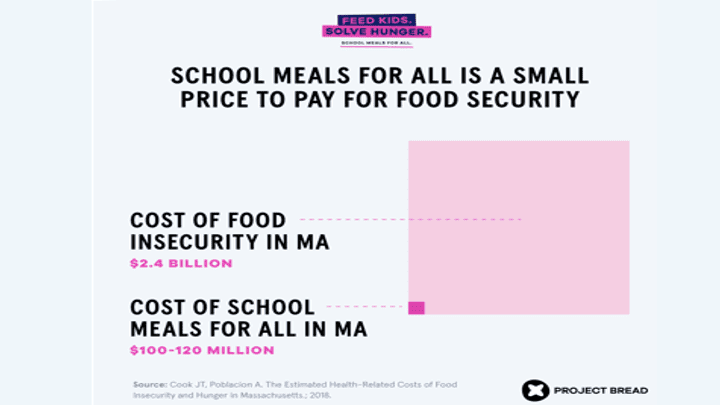
Figure 1: “It’s just Good Economics: The Case for School Meals for All?”
In another example, all UK residents are automatically entitled to equitable free public health care that includes hospital, physician, and mental health care. This represents 9.7% of GDP spent on healthcare, while the US spent 17.2% of GDP on healthcare in 2016. And while saving money is important, more important are the social outcomes. One measure of healthcare outcome effectiveness is life expectancy. The life expectancy for men and women in the US in 2016 was 76.4 and 81.4 years, while in the UK it was 79.04 and 82.72 respectively.
God Thinks Like an Economist
Yes, we can achieve positive economic outcomes driven by the variables of fairness, equality, justice, and generosity that the Bible promotes. As the Bible lessons highlight, we must evaluate our economic decisions against a more holistic set of variables and metrics, including the potential costs of not acting.
That’s exactly how we need to think as “Citizens of Data Science.” We need to measure the longer-term economic impact of our decisions against a broader set of variables and metrics including customer, employee, partner, society, environmental, diversity, and ethical consequences if we are to build AI / ML models that are “good enough” considering the costs associated with AI / ML model False Positives and False Negatives (Figure 2).
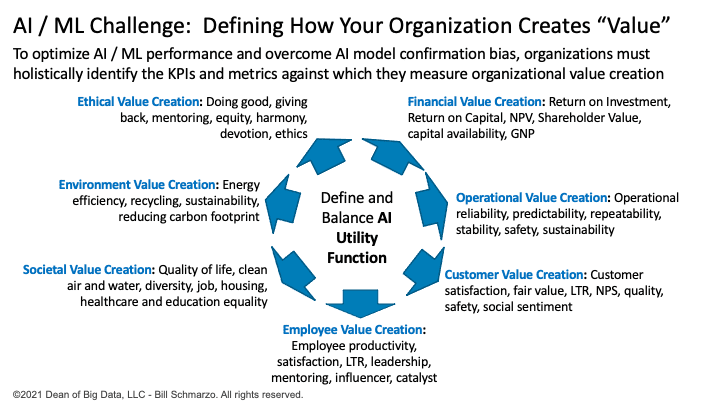
Figure 2: AI / ML Development Challenge: Defining How Your Organization Measures Value Creation
The World of Data Economics
I’m always pleasantly surprised by the linkage between data science and economics. We live in a wonderful time – as both data scientists and economists – where data and analytics are driving new Data Economic theorems that we can use to guide our economic-based value creation decisions.
Everyone needs to understand the interplay between economics and data science as we seek to improve our ability to make informed, economic-based decisions in an imperfect world (Figure 3).
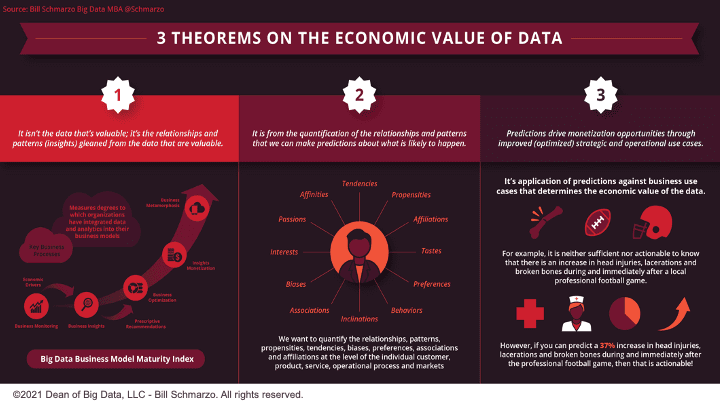
Figure 3: Three (3) Theorems on the Economic Value of Data
To kick off that discussion, here are 12 Data Economics concepts – my Data Economics Dirty Dozen – that everyone needs to understand.
Bring on that Nobel Prize in Economics!
The Data Economics Dirty Dozen
Data Economics Theorem #1: It isn’t the data that’s valuable, it’s the trends, patterns, and relationships (predictive insights) gleaned from the data that are valuable (Figure 4).
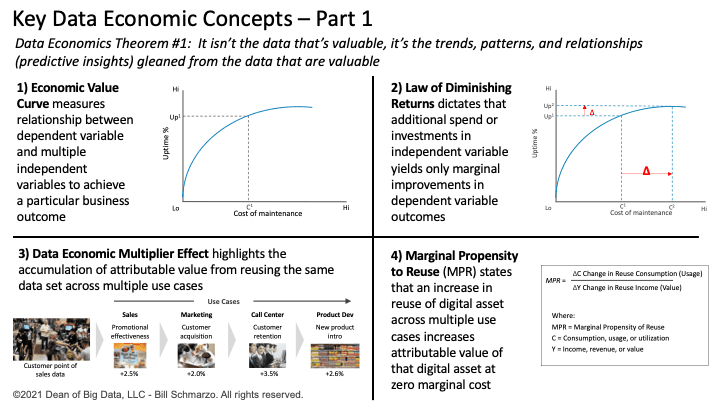
Figure 4: Key Data Economic Concepts – Part 1
- Economic Value Curve. The Economic Value Curve measures the relationship between a dependent variable and multiple independent variables to achieve a particular business outcome. The Economic Value Curve measures the impact that increasing or decreasing one of the independent variables has on the dependent variable (the business outcome).
- Law of Diminishing Returns. The Law of Diminishing Returns is a measure of the decrease in the marginal (incremental) output of production as the amount of a single factor of production (input) is incrementally increased, while the amounts of all other factors of production are held constant.
- Data Economic Multiplier Effect. The Economic Multiplier Effect highlights the impact realized from the accumulation of attributable use case value from reusing the same data sets across multiple use cases.
- Marginal Propensity to Reuse (MPR). The Marginal Propensity to Reuse states that an increase in the reuse of a digital asset across multiple use cases drives an increase in the attributable value of that digital asset at marginal cost.
Data Economics Theorem #2: It is from the quantification of the trends, patterns, and relationships that we make predictions about what is likely to happen (Figure 5).
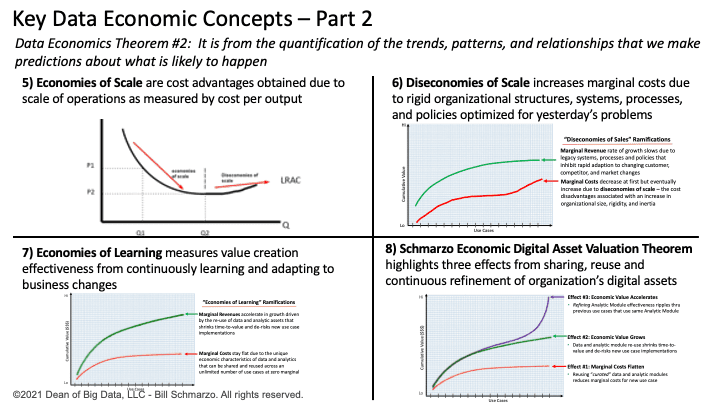
Figure 5: Key Data Economic Concepts – Part 2
- Economies of Scale. Economies of Scale are cost advantages obtained due to the scale or size of operations as measured by cost per output.
- Diseconomies of Scale. Diseconomies of Scale increase marginal costs due to rigid organizational structures, systems, processes, and policies optimized for yesterday’s processes, problems, and use cases.
- Economies of Learning. Economies of Learning measure value creation effectiveness from continuously learning and adapting the organization’s economic assets based upon changes to the operational environment in which it operates.
- Schmarzo Economic Digital Asset Valuation Theorem. The Schmarzo Economic Digital Asset Valuation Theorem highlights how organizations can reduce marginal costs, increase marginal revenues, and accelerate value creation by sharing, reusing, and continuously refining the organization’s data and analytic assets.
Data Economics Theorem #3: Predictions drive value realization through improved decisions that optimize the organization’s strategic and operational use cases (Figure 6).
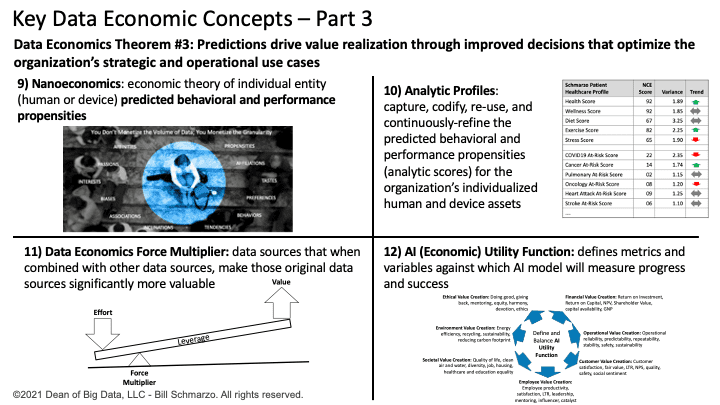
Figure 6: Key Data Economic Concepts – Part 3
- Nanoeconomics. Nanoeconomics is the economic theory of individual entity (human or device) predicted behavioral and performance propensities. Leveraging nanoeconomics, we can transition from making decisions based on averages to making individualized, precision decisions based upon an individual entity’s predicted behavioral and performance propensities.
- Analytic Profiles. Analytic Profiles capture, codify, re-use, and continuously refine the predicted behavioral and performance propensities (analytic scores) for the organization’s individualized human and device assets.
- Data Economic Force Multipliers. Data Economic Force Multipliers are processes that make those original data sources significantly more valuable when combined with other data sources. A force multiplier refers to a factor that dramatically increases, hence multiples, the effectiveness of a system.
- AI (Economic) Utility Function. AI (Economic) Utility Function defines the variables and metrics against which the AI model will seek to optimize and against which the AI model will measure its progress and success as it interacts within its environment to achieve a specific outcome.
Summary: God is an Economist!
More and more I am seeing the blending of the worlds of data science and economics. That’s critically important as we ethically seek to “Do Good” (which is very different from “Do no harm”…remember the Proverb of the Good Samaritan) with data and analytics.
Many of the Data Economic concepts covered in this blog are critical for ensuring that we are properly defining, executing, and interpreting our data-driven analytic results, including:
- Defining Value Creation. Understanding how organizations create value and identifying the KPIs and metrics against which value creation effectiveness is measured is the starting point for any analytics project. If we do not clearly understand how the organization creates value and those KPIs and metrics against which value creation effectiveness is measured, we will never develop the AI / ML models that deliver the desired outcomes.
- Defining AI Utility Function. The execution of an AI model is controlled by its AI Utility Function. The AI Utility Function is comprised of the variables and metrics against which the AI model will seek to optimize. Define an incomplete set of variables and metrics against which to optimize, and your AI model will likely deliver undesirable results and unintended consequences. For example, if you only optimize on clicks, shares, and comments on social media, then you could end up with Confirmation Bias in the articles and posts that the AI model posts on your personal feed.
- Quantifying Costs of False Positives and False Negatives. Understanding when an AI / ML model’s accuracy, recall, and precision is “good enough” requires the identification and quantification of the costs associated AI / ML model’s False Positives and False Negatives. And the instrumentation and tracking of False Positives and False Negatives is key for building AI / ML models that continuously learn and adapt.
God is an economist and expects that all Citizens of Data Science will factor in variables of fairness, equality, justice, and generosity in defining and measuring the effectiveness of our AI / ML models. And if we don’t, well, remember that flood and ark thing…