
In Part 1 of the “Building Blocks for Modern Data Management”, I explored two important modern data management concepts: Data Subassemblies and Data Products (Figure 1).
- Data Subassemblies are the packaging and pre-wiring of data and its supporting accouterments (e.g., enriched metadata, data access methods, data governance policies and procedures, data access security protocols, data quality scores, privacy rules and regulations, usage patterns) into a single “package” to simplify data discovery, access and exploration to optimize the effectiveness and productivity of data workers (e.g., data engineers, data scientists, business analysts).
- Data Products are a packaging of AI / ML analytics and customer, product, service, and/or operational analytic insights (predicted behavioral and performance propensities) as an application to help end users (non-data workers) achieve specific business or operational outcomes.
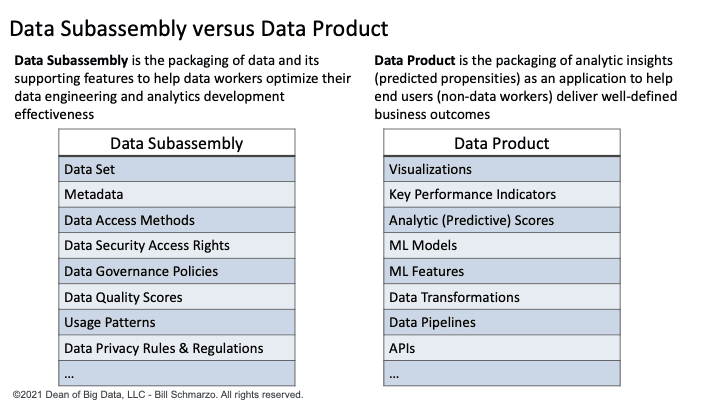
Figure 1: Data Subassembly versus Data Product
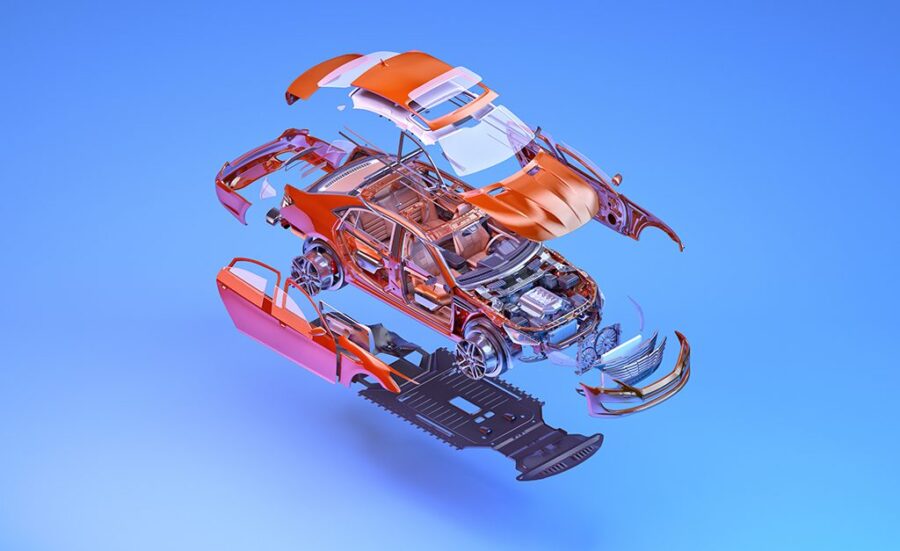
As a real-world example, automotive subassemblies were instrumental in driving product consistency, reliability, quality, cost efficiencies, and scale in the automotive industry by increasing production efficiencies, reducing time-to-final-product, decreasing manufacturing risk, reducing assembly failures, improving quality and reliability, and decreasing costs associated with labor, manufacturing, procurement, inventory, logistics, maintenance, and support (Figure 2).
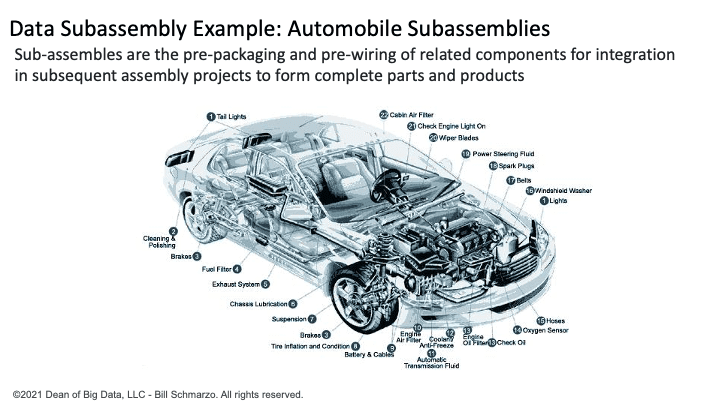
Figure 2: Automotive Subassemblies
In Part 2 of this series, I want to drill into the economic aspects of Data Subassemblies and Data Products. I also want to explore the important role of these two data management “products” in accelerating an organization’s data management journey from business need to business outcome.
The Economics of Data Subassemblies
The reason I separate Data Subassemblies from Data Products is that the same Data Subassemblies can be reused in the development of multiple “Data Products”. For example, a retail “Point of Sales (POS) Data Subassembly” – Point of Sales data packaged with its associated metadata, access methods, data governance policies, access security protocols, data quality scores, etc. – could be reused across multiple Retail Data Products including:
- Merchandising Data Product used to make in-store merchandising and pricing recommendations based upon individual store and customers’ purchase propensities.
- Customer Retention Data Product used to flag and make recommendations to remediate potential customer attrition issues.
- Customer Acquisition Data Product used to make customer targeting and promotional recommendations based upon “like” customer profile purchase behaviors and propensities.
- Customer Up/Cross-Sell Data Product used to make product recommendations based upon individual customers’ shopping and product behaviors and preferences.
- Inventory Management Data Product used to make stocking and mark-down recommendations that seek to reduce out-of-stock and optimize mark-down management.
- New Product Introduction Data Product used to make new product merchandising, promotional, and pricing recommendations that increase the probability of successful new product introductions.
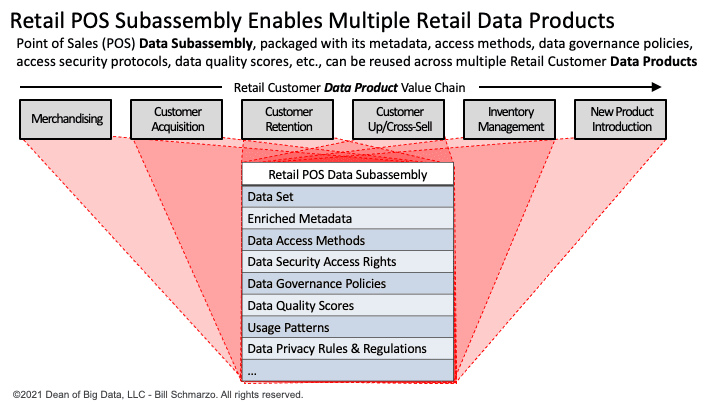
Figure 3: The Economics of Data Subassemblies
If those Data Subassemblies are engineered for sharing, reuse, and continuous refinement, then the reuse of those Data Subassemblies can occur at near zero marginal cost making them a very powerful digital economic asset. Plus, any improvements in the quality, accuracy, completeness, latency, granularity, and enrichment of the Data Subassemblies ripples through every Data Product that reuses that same Data Subassembly, fueling the Schmarzo Economic Digital Asset Valuation Theorem (Figure 4).
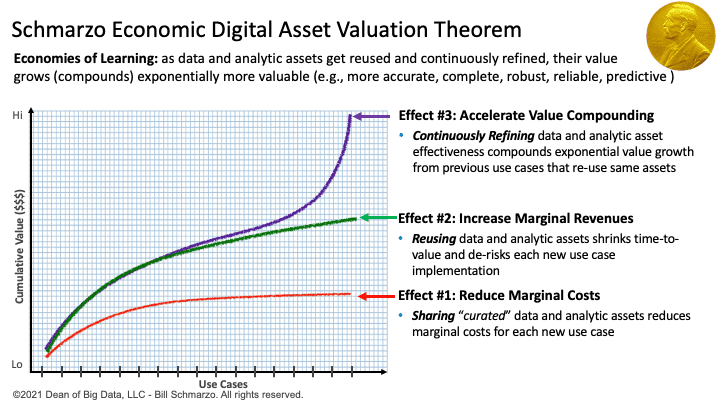
Figure 4: Schmarzo Economic Digital Asset Valuation Theorem
Data Subassemblies, Data Products, and the Data Management Journey
In the blog “Fallacy of Becoming Data-driven – Part 1: Becoming Value-obsessed” I introduced the Data Management Candy Land Journey. The goal of the Data Management Candy Land Journey was to highlight the key data management outcomes, and execution dangers, in unleashing the economic value of an organization’s data by accelerating the data management journey from business need to business outcome (Figure 5).
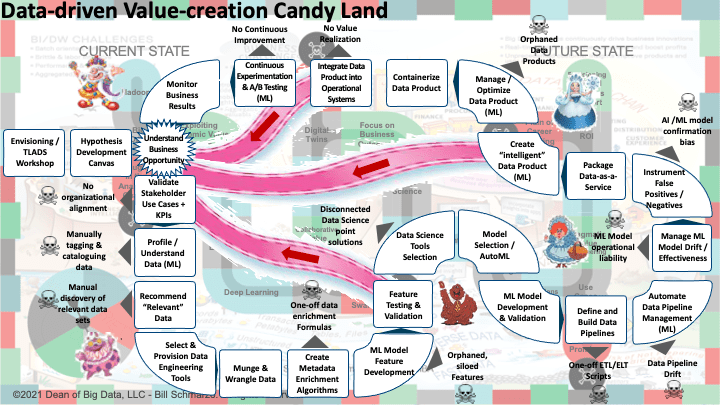
Figure 5: Data Management Candy Land Journey
I got marvelous feedback on how organizations were using this journey map to guide their data management efforts (but wanted a version that could be shared with business leadership). Consequently, I created a simpler (less fun) version that could be used with business leadership to depict the key data management outcomes necessary to accelerate an organization’s data journey from Business Need to Business Outcome (Figure 6).
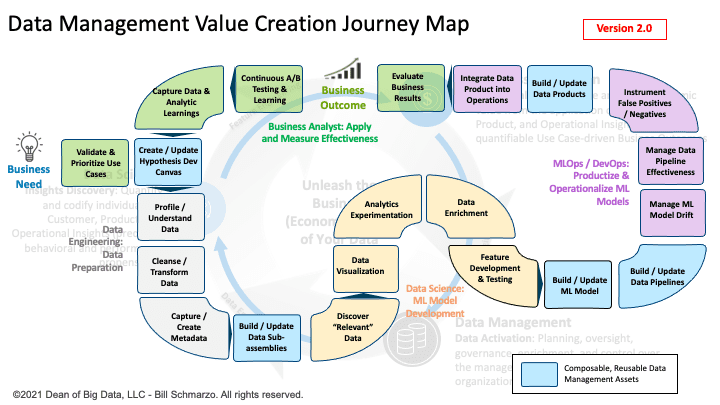
Figure 6: Data Management Value Creation Journey Map – Version 2.0
Some key take-aways from the version 2.0 Data Management Journey Map:
- Guides the organizations transition from one-off data projects to reusable, refinable data products. The updated Data Product Development Canvas and the new Data Assemblies Development Canvas will be covered in my next blog in this series.
- Data Subassemblies and Data Products are economic assets that enable organizations to accelerate and scale their data-driven, value-creation data management journey from Business Need to Business Outcome.
- The ability to share, reuse, and continuously refine the Data Subassemblies and Data Products distinguishes these products as critical enablers for unleashing the business or economic value of the modern organization’s data.
- The data management journey is a continuous cycle where the Business Outcomes feed the next iteration of the journey. And if properly instrumented with Data Observability, we can create a data management journey that leverages AI / ML to continuously learn and adapt with minimal human intervention (semi-autonomous). See my blog “Data Observability and Its Importance in Determining Intent” for more details on how to leverage data observability to create continuous learning and adapting processes.
- The image behind the Data Management Journey Map Version 2.0 is the Data & Analytics Business Model Maturity Index. Why? Because ultimately, the goal of any modern organization is to become more effective at leveraging data and analytics to power their business and operational models. Yea, that’s what it’s all about.
Data Subassemblies and Data Products Summary
Data Subassemblies and Data Products as packaged, sharable, reusable, and continuously refinable assets that enable organizations to become more effective at scaling the economics of data and analytics across the organization.
In my next blog in this series, I will introduce the updated Data Product Development Canvas. Several folks have offered to review that next iteration, so it should be pretty good.