

The movie of the summer of 2022 is no doubt “Top Gun: Maverick.” Fast moving, tons of aerial combat, lots of excitement, and the youngest-looking Tom Cruise I’ve ever seen (not one stitch of grey hair on his head). There’s gotta be a Data Science lesson in there somewhere…
And the good news is that there is, and that lesson revolves around how fighter pilots gather, infer, analyze, and act on the multiple streams of real-time data that impacts their success (and survival) as fighter pilots.
Fighter pilots employ a methodology called the OODA Loop (observe–orient–decide–act) to guide their real-time decision-making to increase their odds of a successful engagement.
As my co-author on this blog Mark Stouse, Chairman and CEO of Proof Analytics, explained to me that the OODA loop has its roots in aerial combat and exemplifies the fighter pilot maxim that “speed is Life.”
To quote Mark:
“The essence of combat is making rapid, imperfect decisions in a roiling environment that keep your people alive and enable you to complete the mission. You’ve heard the phrase “The Fog of War,” right? If that’s the case in ground combat, imagine what it’s like in the air.
In aerial combat, our conventional ideas about a three-dimensional world are shattered. Your speed is Mach 2, and your adversaries are moving just like you. That means in an air battle closing speed could be well over Mach 4.
Your saving grace – what separates you from failure and death – isn’t absolute precision or better weapons or better vision or better reflexes but an OODA loop that is faster than the other guys’ OODA loops. If you can make a better decision faster than s/he, you win. Given the physical speed and the limitations of the unaided human brain, this is why the cockpits of combat aircraft are where we see some of the most advanced automation, machine learning, and predictive analytics.”
Sounds like OODA is the ultimate realization of the “economies of learning” benefits, but if everyone is playing the same “economies of learning” game, then learning speed and application distinguishes organizational survival from death.
Let’s make sure we understand OODA and how it works.
What is OODA?
The OODA loop is a four-cycle “observe–orient–decide–act” process developed by military strategist and United States Air Force Colonel John Boyd. Boyd applied the concept to the combat operations process, often at the operational level during military campaigns (Figure 1).
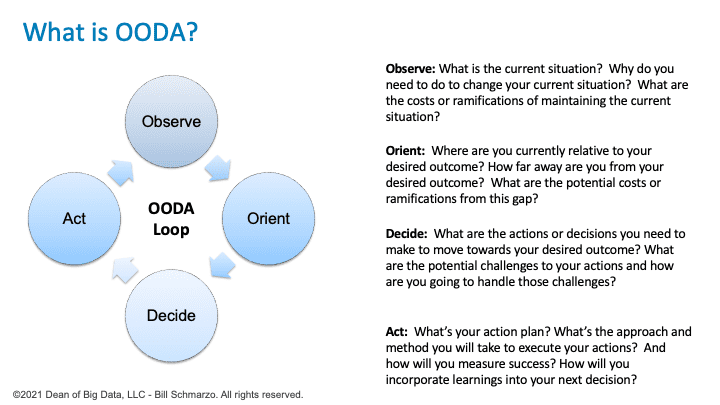
Figure 1: Observe-Orient-Decide-Act (OODA) Decision-making Loop
The OODA Loop approach highlights the importance of agility and rapid decision-making when operating within a rapidly changing environment; to make data-informed decisions when operating in an imperfect world.
The four stages of OODA are:
- Observe: What is the current situation? Why do you want or need to change your current situation? What are the costs or ramifications of maintaining the current situation?
- Orient: Where are you currently at relative to where you want to be or where you need to go? How far away are you from your desired destination or outcome?
- Decide: What actions or decisions do you need to take or make to achieve your desired outcome? What are the potential challenges or setbacks to your actions, and how are you going to handle those challenges or setbacks?
- Act: What’s your action plan? What’s the approach and method you will take to execute your actions? And how will you measure success?
Mark says: “Since the 1950s, the value of OODA has been clear, and many other groups have adopted it as the fundament of their operational approach, particularly professions where both the velocity and the proliferation of factors have exploded. Twenty-four-hour news coverage brought OODA into the lives of journalists and those they covered. Law enforcement began to use OODA, as did firefighters and other emergency first-responders. In business, OODA means making better decisions at the clock speed of the business and faster than your competitors can react. If your analytics lag the clock-speed of the business, your analytics will lose value in proactive decision-making.”
In our everyday lives, OODA is personified in the GPS on your iPhone. It helps you observe your current state, get oriented to your environment, makes a decision, and act. And it’s constantly doing this for you. If circumstances demand a change, the GPS will alert you to change to a different route and recalculate your arrival time, complete with a countdown to your destination.
Data Science Development Methodology
The Data Science Collaborative Engagement Process is marked by the highly non-linear, heavily iterative “rapid exploration, discovery, training, testing, failing and learning” collaboration process (Figure 2).
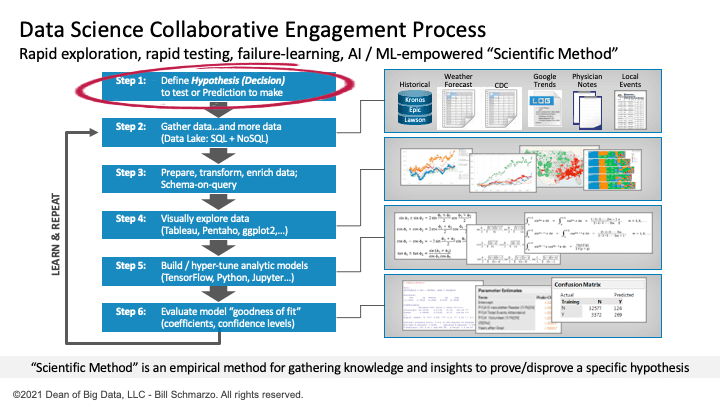
Figure 2: Data Science Collaborative Engagement Process
The Data Science Engagement methodology requires the intimate involvement of the business stakeholders and Subject Matter Experts (SME) to ensure that the data science team focuses on uncovering analytic insights that pass the S.A.M. test – Strategic (to the business), Actionable (insights that the organization can actually act on), and Material (where the value of acting on the insights is greater than the cost of acting on the insights).
The Data Science Collaborative Engagement Process includes the following steps:
- Step 1: Define Hypothesis to Test. The data science process starts with the data science identifying, validating, and valuing the prediction or hypothesis they want to test.
- Step 2: Gather Data. The data science team gathers relevant and/or interesting data from a multitude of sources – ideally both internal and external to the organization.
- Step 3: Build Data Model. The data science team defines and builds the data model (logical or physical) necessary to integrate the data for the hypothesis being tested.
- Step 4: Explore the Data. The Data Science team leverages SQL, Python, and data visualization tools to uncover data correlations and outliers of interest.
- Step 5: Build and Refine Analytic Models. The data science team starts exploring and testing different data sources, different data transformations, and different analytic algorithms to build analytic models.
- Step 6: Ascertain Goodness of Fit. The data science team ascertains the model’s goodness of fit and measures how well the model fits a set of observations.
- Step 7: Iterate and Try Again. The Data Science team iterates through the process, trying to improve model accuracy, precision, and recall, given the costs of model false positives and false negatives.
Blending OODA and the Data Science Methodology
A couple of things jump out at me when I think about integrating what’s best about OODA with the Data Science Engagement approach.
Lesson #1: Speed of decision can be as important as the accuracy of decision
- In certain situations, the speed of decision-making can be as important – or more so – than the accuracy of the decision. Sometimes “hand grenade range” is accurate enough given the urgency of the decision.
- The Data Science team needs to contemplate the costs of delayed decisions in their analytics development process. “Delaying a decision” is making a decision, and a good data science team must factor in delayed decisions’ costs into their analytic model development processes.
Lesson #2: When is “good enough” really “good enough”
- One of the data science challenges highlighted by OODA is what Mark calls the “Cult of Precision.” Exemplified by strict adherence to the 95 percent confidence score statistical relevance, the Cult emphasizes statistical accuracy and precision over any other delivered Value. This is the introduction of systemic bias.
- For example, while 95 percent can apply to the physical sciences, as soon as human behavior becomes a part of the model, 95 percent becomes unobtainable except through over-fitting. This accounts for the difference between the physical science observations about Climate Change (very high confidence scores) and the social and societal calculations about the extent to which human behavior is causal.
- In a question involving human behavior like Business, the real issue is not being able to predict with 95% certainty what will happen but being able to stay current with and react promptly to the changing realities that impact your business.
- Former Honeywell CEO Dave Cote often said that the average business decision, if modeled, would have a confidence score of 35% or less. “If you present me with answers with 60% confidence scores, that’s gold. And if you can recalculate the model every week to confirm actual performance versus what was forecasted, account for the deltas, and have a plan for getting back on track, you’re a hero.”
Lesson #3: Exploit the economical Power of Compounding.
- A continuous stream of small improvements in decisions can be more powerful than one big improvement in decision-making. If you’re trying to solve cancer, folks with cancer can’t afford to wait until you have 100% confidence in the solution. These folks – including my mom, who died from cancer – appreciate even small improvements in their odds of survival. A ½ percent improvement in decision-making daily for a year equates to a ~2000 percent Year of Year improvement!
- The frequency and latency of model recalculation become significantly more important in delivering the best answers when human behavior is a significant part of the model. The confidence score could easily start in the 40s, but this by itself does not equate to irrelevance. The ability to forecast and then recalculate the models frequently reveals the extent of the delta between forecast and reality in the context of changing conditions. In short, analyzing human behavior is far more like working on a navigation problem – think GPS – in a stormy sea than any set-piece calculation in a more static or long-term environment.
- If the issue is really a learning problem, then the answer to “what is good enough?” is whatever gets you to your objective in the shortest time, given the headwinds and tailwinds your data science fighter pilot must encounter.
Lesson #4: It’s All about Improving Your Odds.
- We go through these analytic processes to improve the odds of making a better decision. Whether it’s for reducing customer attrition or improving operational uptime or reducing logistical costs or reducing COVID-related deaths or reducing our odds of being eaten by a saber-toothed tiger, we seek to leverage data and analytics to improve the odds of making a better decision.
Lesson #5: In business, it’s about getting there. Achieving your objective.
- In short, almost every business question is really a navigational question.
- We need to move from where we are to this new objective. We can plot a course – a forecasted route to value – to attain that goal within a given period.
- But we are not operating alone in a static environment. There are currents in the oceans, winds that change speed and direction, and issues with our vessel that mean that our actual course deviates – sometimes extensively – from the plot line. The longer we go between location fixes (new data introduced into the model), the further we can drift away from the route to value. Our risk, and the eccentricity of our return course, become problematic in these situations.
- Just as in a navigation question, once we determine our delta from our forecasted course and what is pushing our boat off course, we can take steps to correct and get back on track.
OODA Summary
The OODA Loop is a feedback loop that accounts for you and everything around you that’s relevant to your next step. Of course, after you Act, then you begin the cycle all over again (Observe-Orient-Decide-Act again) with the determinant of success and survival dependent upon the quality and speed of the decisions given the decision latency constraints.
The challenge of the accuracy versus speed tradeoff is that no general rule governs when to weigh one more than the other. The accuracy versus speed tradeoff needs to consider the latency of the decision, something with which organizations are struggling as they implement real-time edge capabilities at the point of customer and operational engagement. But latency is also relative to the clock speed of the business. In retail, where the clock speed is measured in hours, acceptable latency maxes out at one day. But in aerospace technology, a very long cycle industry, the clock speed is much slower. One day of latency in OODA would be too fast, showing little or no difference of any note.
An organization’s ability to derive and drive value from their real-time edge implementations requires a thorough understanding of the business benefits and costs associated with time in making informed decisions (Figure 3).
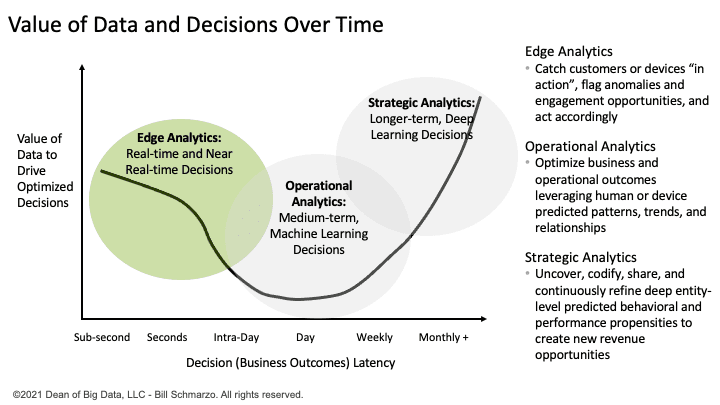
Figure 3: Framework for the Decision Accuracy versus Speed Dilemma
The success of the Data Science Engagement process is determined by how quickly the data science team can iterate through the data science process, balancing 1) the time costs of decisions vis-à-vis 2) the accuracy costs of those decisions (especially when the costs of the false positives and false negatives are taking into consideration).
Just like Maverick, we must constantly balance accuracy versus speed in developing our models. Do that successfully, then you’ll put your organization on the highway to the danger zone!
“I feel the need for speed (and sometimes the need for accuracy)!”