

In the blog “Why Data Management is Today’s Most Important Business Discipline”, I challenged the business and IT communities to reframe the data management conversation; to transform data management from an IT practice into a business discipline focused on leveraging data (and analytics) to deliver business and operational outcomes.
If data is “the world’s most valuable resource” (thank you “The Economist”), then business leadership must reframe their expectations of data management as a business discipline to guide the organization in leveraging data to derive and drive new customer, source, product, service, and operational value.
But what is a business discipline, and what do we need to create to fulfill that vision of data management as a business discipline?
What is a Discipline?
A Discipline consists of systematic research, observation, measurement, and experimentation resulting in the assimilation of learnings into laws, theorems, concepts, principles, practices, frameworks, and formulas to enable the consistent application and ongoing enhancements from the real-world application of that discipline.
According to the article “6 Attributes of an Academic Discipline” written by Joshua Ki, an Academic Discipline is comprised of the following characteristics:
1 – Object of Research. “Disciplines have a particular object of research (e.g., finance, economics, mathematics, computer science), though the object of research may be shared with another discipline.”
2 – Accumulated Specialist Knowledge. “Disciplines have a body of accumulated specialist knowledge referring to their object of research, which is specific to them and not generally shared with another discipline.”
3 – Theories and Concepts. “Disciplines have theories and concepts that can organize the accumulated specialist knowledge effectively.”
4 – Terminology. “Disciplines use specific terminologies or a specific technical language adjusted to their research object.”
5 – Research Methods. “Disciplines have developed specific research methods according to their specific research requirements.”
6 – Institutional Manifestation. “Disciplines must have some institutional manifestation in the form of subjects taught at universities or colleges, respective academic departments and professional associations connected to it.”
I think that Data Management checks each of these boxes from an Academic Discipline perspective. And I’m going to add #7 from a Business Discipline perspective:
7 – “Disciplines have documented best practices, learnings, and stories associated with the successful and not successful application of that discipline in real-world situations to create a quantifiable and sustainable business and operational value.”
For a business discipline to be relevant and secure the commitment of business and IT leadership, that discipline must create value. And how can we guide those value-creation conversations?
Introducing the Value Creation Playing Cards!
Yes, we can create a series of playing cards that summarize the value creation theories and concepts (Discipline requirement #2) that our Data Management Business Discipline must embrace.
Plus, think about how much fun it would be to whip out these playing cards in meetings with either your business stakeholders or your data and analytics teams as a reminder that the focus of these data management efforts need to be around value creation.
Let’s review these cards and start envisioning how you might use these cards to create a value-driven (through data and analytics) culture!
The Royal Court of Data & Analytics-driven Value Creation
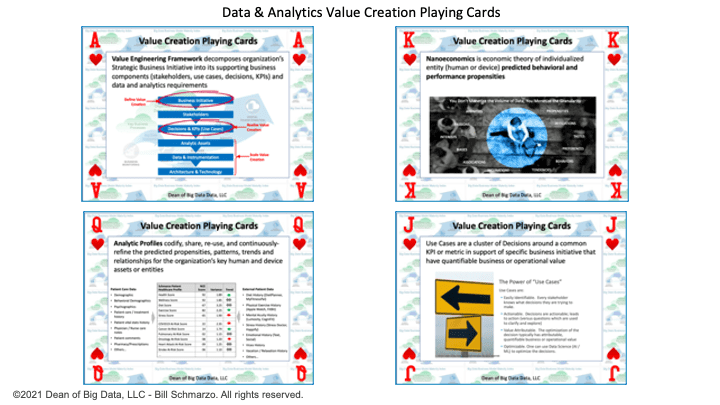
Figure 1: The Royal Court of Data & Analytics-driven Value Creation
- Value Engineering Framework decomposes the organization’s Strategic Business Initiative into its supporting business components (stakeholders, use cases, decisions, KPIs) and data and analytics requirements.
- Nanoeconomics is an economic theory of individualized entity (human or device) predicted behavioral and performance propensities.
- Analytic Profiles codify, share, re-use, and continuously refine the predicted propensities, patterns, trends and relationships for the organization’s key human and device assets or entities.
- Use Cases are a cluster of Decisions around a common KPI or metric in support of specific business initiatives that have a quantifiable business or operational value.
The Lieutenants of Data & Analytics-driven Value Creation
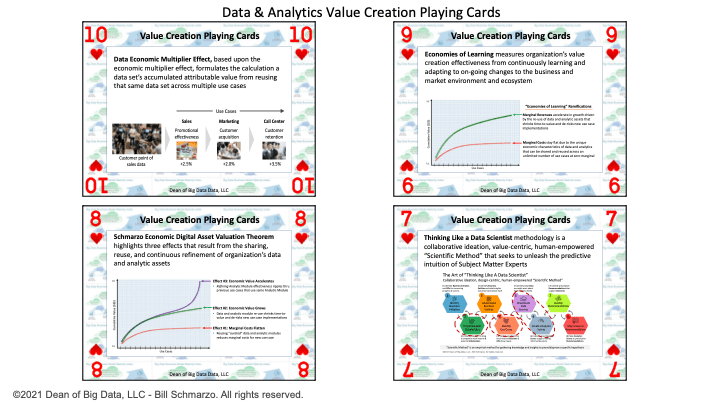
Figure 2: The Lieutenants of Data & Analytics-driven Value Creation
- Data Economic Multiplier Effect, based upon the economic multiplier effect, formulates the calculation a dataset’s accumulated attributable value from reusing that same data set across multiple use cases.
- Economies of Learning measures an organization’s value creation effectiveness from continuously learning and adapting to ongoing changes to the business and market environment and ecosystem.
- Schmarzo Economic Digital Asset Valuation Theorem highlights three effects that result from the sharing, reuse, and continuous refinement of an organization’s data and analytic assets.
- Thinking Like a Data Scientist methodology is collaborative ideation, value-centric, human-empowered “Scientific Method” that seeks to unleash the predictive intuition of Subject Matter Experts.
The Foot Soldiers of Data & Analytics-driven Value Creation
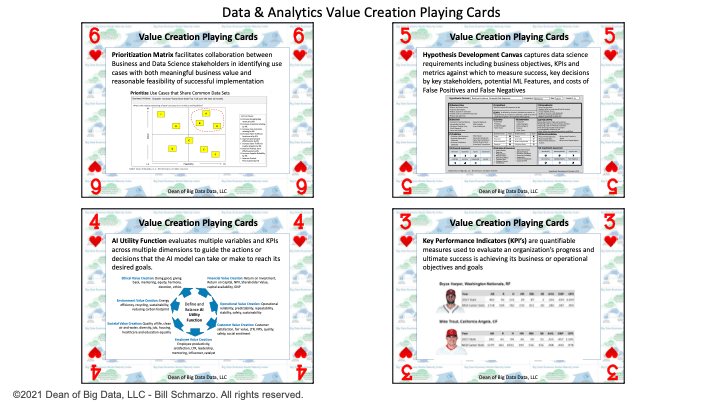
Figure 3: The Foot Soldiers of Data & Analytics-driven Value Creation
- Prioritization Matrix facilitates collaboration between Business and Data Science stakeholders in identifying use cases with both meaningful business value and reasonable feasibility of successful implementation
- Hypothesis Development Canvas captures data science requirements including business objectives, KPIs and metrics against which to measure success, key decisions by key stakeholders, potential ML Features, and costs of False Positives and False Negatives
- AI Utility Function evaluates multiple variables and KPIs across multiple dimensions to guide the actions or decisions that the AI model can take or make to reach its desired goals.
- Key Performance Indicators (KPI’s) are quantifiable measures used to evaluate an organization’s progress and ultimate success is achieving its business or operational objectives and goals.
The Wild Cards of Data & Analytics-driven Value Creation
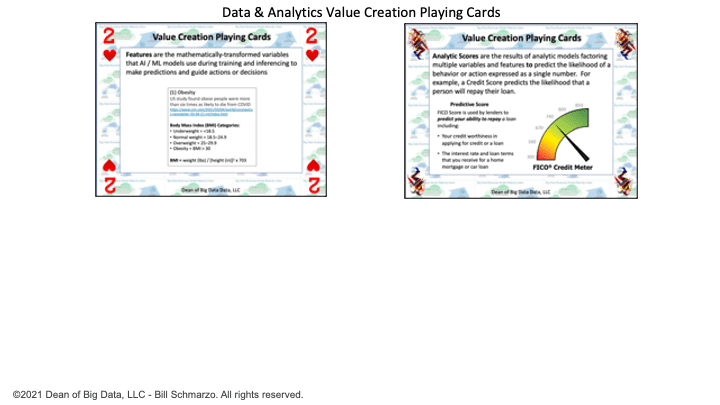
Figure 4: The Wild Cards of Data & Analytics-driven Value Creation
- Features are the mathematically-transformed variables that AI / ML models use during training and inferencing to make predictions and guide actions or decisions
- Analytic Scores are the results of analytic models factoring multiple variables and features to predict the likelihood of a behavior or action expressed as a single number. For example, a Credit Score predicts the likelihood that a person will repay their loan.
Data & Analytics-driven Value Creation Playing Cards
I hope that this article provided both some fun and a shot of creativity in how your organization could leverage the value creation playing cards to start to reframe the data management conversations and expectations – that data management is not just an IT practice but is becoming the most important Business Discipline in the 21st century.
Now, I just need to figure out affordably how to turn these into actual (affordable) playing cards that I can hand out at my workshops (now that would be very cool!!).