

The best way to model business and consumer dynamics is collaboratively, with stakeholders all in the same virtual room contributing. Of course, this has been happening asynchronously for some time now, but the potential exists for more real-time interaction.
Modelers don’t work in a vacuum, of course. The iterations between a modeler who develops a straw man and the stakeholders who know the domain is critical.
No wonder shared online whiteboarding has become popular. But how do you capture and reuse the data that underpins the model without disrupting the ongoing collaboration? Front- and back-end designers need to work together and solve this key technical challenge.
Interactive graph modeling
Synergy Codes (SC) is a custom data visualization product development firm that has been working more on graph-related projects. For internal project management and human resources purposes, they’ve built a knowledge graph-based recommendation app to match skills to particular projects.
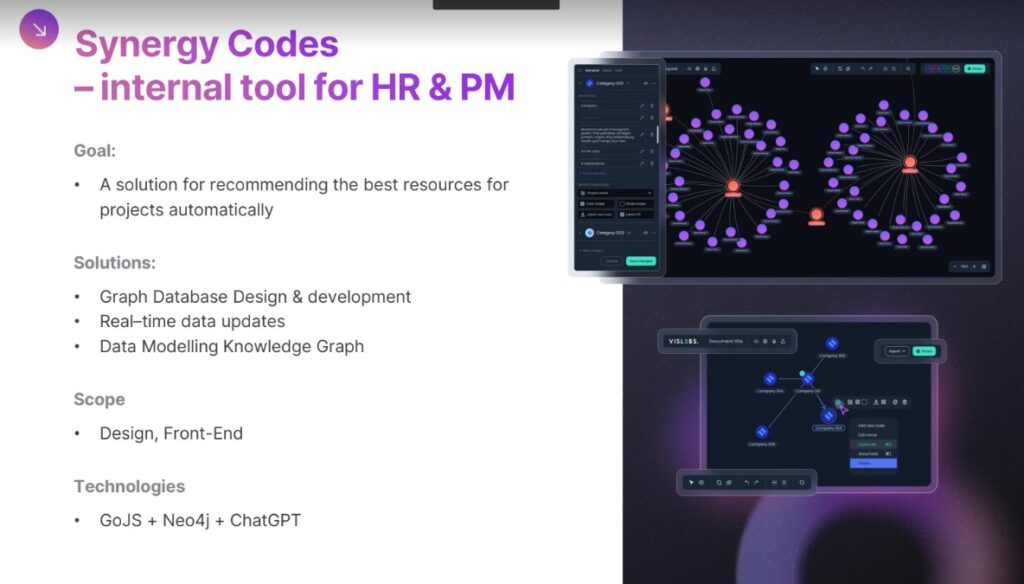
Lately, SC has been working toward adding an interactive capability. For now, the company makes it possible to optical character recognition (OCR) scan a node-and-edge diagram on a shared screen and make the diagram editable. Obviously more needs to be done to enable seamless back-and-forth between shared visual diagramming and a knowledge graph stored in standard form in a graph database. SC supports Neo4j and is considering support for Mongo DB or Postgres AgensGraph.
Knowledge graphing has become an effective and scalable way to model things at the data layer and make them interoperable at a system level. Graphs–models expressed in terms of any-to-any edges and nodes–are the mothers of all the data modeling children, which means interoperation between disparate elements of the model is built in.
A data modeler working in graphs can bring together tables (in relational databases, for example), documents (in document databases) from different contexts and images and other multimedia (annotated with the help of standard semantic metadata) from other contexts into a single, cohesive graph.
The best graph databases make system-level analysis and management using thousands of heterogeneous sources possible.
How data capture and reuse of visual models happens
Back-end knowledge modelers have been thinking and designing visually since the 2000s, but tooling potential has been haphazard and underfunded.
Here’s how a front-end design process that ties into the full power of back-end connectivity can help. User experience (UX) designers are in the habit of interviewing and learning from end users as a part of their research effort. Now the challenge for companies such as SC is to collaborate also with domain modelers who manage and scale the data connectivity, to help them work visually and expedite their efforts.
Ultimately, the goal of knowledge graph modelers is to create extensible, flexible data contexts that can be shared and reused as simply as possible.
Ethernet pioneer Bob Metcalfe coined the term “network effect.” He describes the connected contexts in a knowledge graph and a less centralized architecture as a means of delivering the “network effect to the Nth power”.
Consider for a minute how knowledge graph modeling can pay off “to the Nth power” in the way that Metcalfe alludes to:
- A knowledge graph makes data the organization wants to keep findable, accessible, interoperable, and reusable (FAIR) in as many ways as there are contexts.
- It also provides a means of sharing description logic–how things fit and interoperate together across contexts–so that this logic can be reused over and over again by calling it from the graph. Rather than trapping this information in apps, the graph makes zero-copy code and data possible.
- This zero-copy capability makes it possible for interactions that create, replace, update, and delete (CRUD) data and description logic to happen just once, for every user and every use.
How digital twins and agents fit in
User and modeler experience designers can harness the power of the zero-copy capability by designing with data in terms of a digital twin and agent paradigm. A twin in this scenario is a knowledge subgraph for a context and function. An agent becomes the messenger relaying the needed information back and forth between users and the graph, as well as modelers and the graph.
All of a sudden, the designer starts to have an impact, not only with a user and one app but at the system level.
The result: Visual model-driven development
When UX + MX designers can help knowledge, engineers, modelers, and architects build systems visually, they scale the impact they can have on innovation. When it’s visual, a higher percentage of the workforce can get involved in the business modeling effort. When it’s visual, even the C-suite can see the benefits of how processes are expressed at the data layer.
Moreover, when the knowledge graph is at the center of the effort, the modeling changes only have to take place once, because conceptual, logical, and physical models are all unified. When adding the interactive visual component with an extensible knowledge graph-oriented architecture, the whole effort boosts interaction and workforce efficiency.