

The end of year always leads to lists of the most impactful technologies from the previous year and projections as to the most impactful technologies for the next year. These are entertaining debates about topics such data meshes vs data lakes vs data fabrics vs data warehouses vs data lakehouses vs data department stores vs data blah blah blah. But ultimately these debates are mindless (sorry) because these debates miss the bigger point:
What can we as technologists do to provide a “clear line of sight” from data to value?
The problem with this specific technology debate is the focus on the word “data” instead of the word “value.” The debate should not be on what these data technologies can do (which with technologies like Neural Networks is quite impressive, such as differentiating between a Chihuahua puppy and a blueberry muffin), but instead the focus of the debate should be on how organizations can create data and analytic assets to derive and drive new sources of customer, product, service, and operational value. The market leaders in Figure 1 are excelling at leveraging data and analytic technologies to create value, and that’s the important debate.
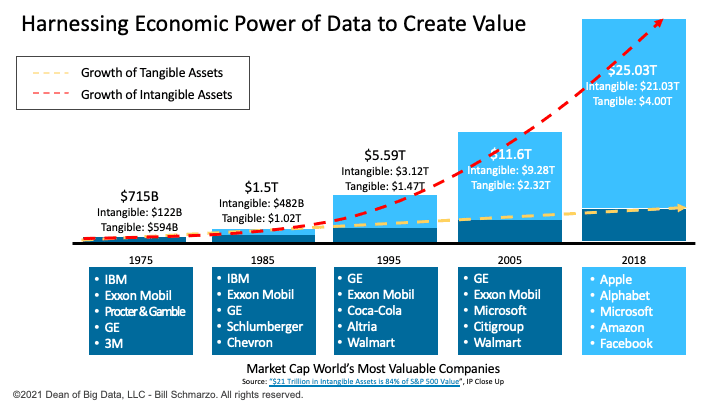
Figure 1: Market Leaders Leverage Data and Analytics to Create Value
Unfortunately, many organizations are struggling in developing their data strategies because these data strategies lack a “clear line of sight” from data to value. Gil Press in Forbes magazine stated that 65% of executives worldwide report that they are not yet seeing value from their AI investments[1]. And Andrew White of Gartner estimates failure rates for analytic initiatives to be greater than 80%[2]. Yikes!
In order to provide a “clear line of sight” from data to value, we must embrace a business-first, value-centric engagement process. And that journey starts by understanding how organizations create, measure, and reward value.
Defining the Sources of Value Creation
The best way to understand how an organization seeks to create value is to start with the organization’s key business initiatives; that is, what is the business trying to accomplish over the next 12 to 18 months. Then conduct an envisioning workshop to drive collaborate across key stakeholders to identify, validate, value, and prioritize their key decisions in support of the organization’s business initiatives, and the KPI’s and metrics against which they will measure decision effectiveness (Figure 2).
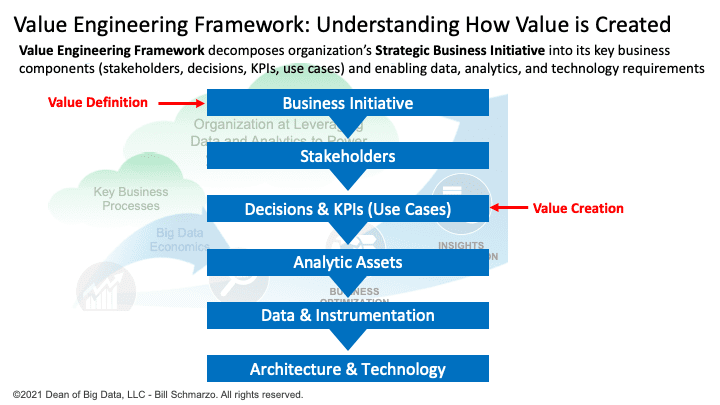
Figure 2: Value Engineering to Understand How Organization Defines and Creates Value
There is no magic here, just some hard work and diligence before you dive into the data, analytic, architecture, and technology discussions.
Now, understanding how organizations define and create value is where things get really interesting. Dollars and cents are the traditional “financial” way to define “value”, but many organizations today are augmenting that view of “value creation” to include customer satisfaction, employee satisfaction, partner/channel financial health, supplier satisfaction, operational excellence, environmental impact, and societal impact (Figure 3).
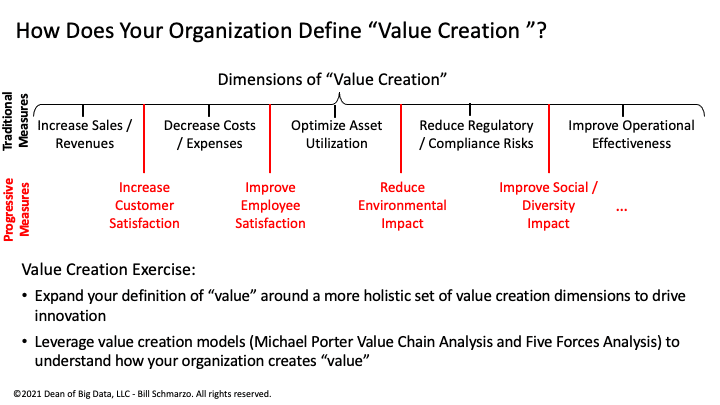
Figure 3: How Does Your Organization Define “Value Creation”?
Many financial metrics are lag indicators or dependent variables whose results are impacted and driven by lead indicators or independent measures such as customer satisfaction, employee satisfaction, partner/channel financial health, supplier satisfaction, operational excellence, environmental impact, and societal impact.
And defining a comprehensive suite of KPIs is crucial as organizations set up their AI / ML models. Without a robust set of KPIs and metrics against which to try to optimize, organizations run the risk of AI model confirmation bias in the decisions that are being generated by these AI / ML models. We are already seeing confirmation bias problems in AI models supporting areas such as employment, loans, housing, and college admissions.
Finally, I believe how your organization defines, measures, and rewards value creation says more about the culture of your organization than any management-defined, top-down-driven mission statement. Or as I once heard John Smale, former CEO of Procter & Gamble, say: “You are what you measure.”
Providing a “Clear Line of Sight” from Data to Value
One of my favorite blogs from 2021 was “Features Part 2: Clarifying the Data-Features-Use Case Value Topology” which described the role of Machine Learning (ML) Features in supporting and optimizing the organization’s most important use cases. Features are the attributes, properties, and data elements used to train ML models that generate Predictive Scores that seek to optimize the organization’s key business and operational use cases.
With some slight modifications to that original graphic, we can apply the Value Engineering concepts to provide a clear line of sight from data to value (Figure 4).
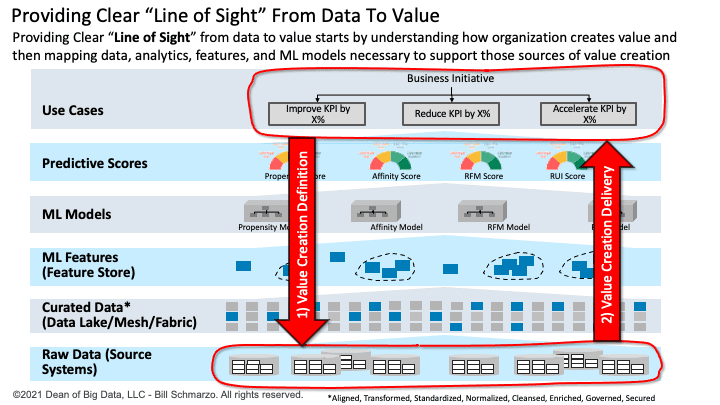
Figure 4: Data-Features-ML Models-Use Cases Topology Provides “Line of Sight” from Data to Value
The key aspects of Figure 4:
- Step 1: Value Creation Definition. Business Initiatives and the supporting Use Cases are the source of organizational value creation, in that there is attributable value in the optimization (reduce, increase, optimize, rationalize, etc.) of the KPIs against which the organization measures the effectiveness of their value creation processes. This is the starting point in the value creation process – to vet the business initiatives, brainstorm with the stakeholders the supporting use cases (decisions + KPIs) that are the sources for “value creation”, and then identifying the enabling data and analytic requirements.
- Step 2: Value Creation Delivery. Once we thoroughly understand the use case and the criteria for how use case success will be measured, then we provide that “clear line of sight” from the raw data through data management and data engineering to the curated data, through the data science and feature engineering to the AI / ML models, and finally through value engineering and business management to deliver meaningful and quantifiable value (Figure 5).
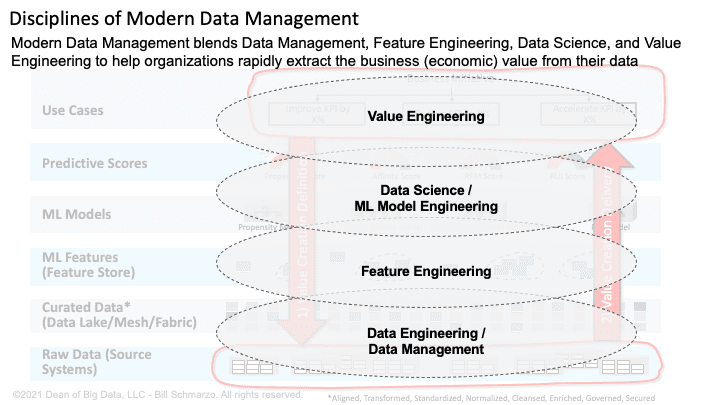
Figure 5: Disciplines of Modern Data Management
Summary: Establishing a Data-driven Value Creation Flywheel
In the blog “Reframing the CXO Conversation: From “Data Monetization” to “Value Creation“, I posed the following challenge:
How do we transform Data Management into a Business “Value Creation” Discipline that is worthy of C-suite attention, focus and strategic investment (and not just another technology activity)?
Or asked another way,
What can we as technologists do to provide a “clear line of sight” from data to value?
As data becomes the ubiquitous source of economic value creation, organizations need an end-to-end “data-driven economic value creation flywheel” that aligns the business executives and the data and analytics teams to unleash the business and operational value of the organization’s data resources (Figure 6).
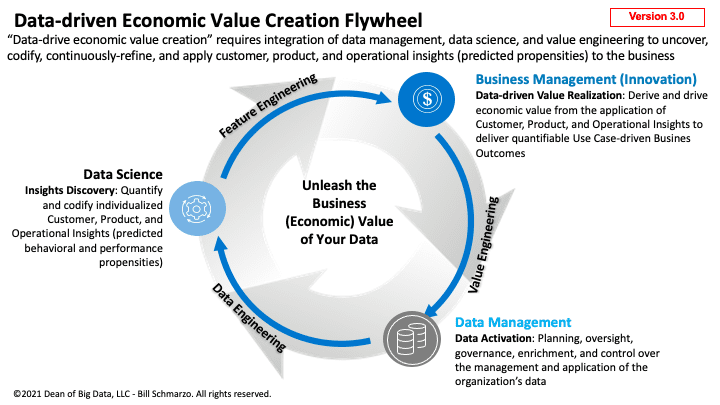
Figure 6: Data-driven Economic Value Creation Flywheel
I love the metaphor of an accelerating flywheel[3] which exploits the kinetic energy of data and analytics to create data monetization rotational value. The flywheel metaphor accentuates the organizational momentum that builds when organizations figure out how to share, reuse, and continuously refine their data and analytic assets to derive and drive new sources of customer, product, service, and operational value.
[1] “AI Stats News: 65% Of Companies Have Not Seen Business Gains From Their AI Investments” https://www.forbes.com/sites/gilpress/2019/10/17/ai-stats-news-65-of-companies-have-not-seen-business-gains-from-their-ai-investments/?sh=528738a19f47
[2] “Our Top Data and Analytics Predicts for 2019” https://blogs.gartner.com/andrew_white/2019/01/03/our-top-data-and-analytics-predicts-for-2019
[3] A flywheel is a device which uses the conservation of angular momentum to store rotational energy, a form of kinetic energy proportional to the product of its moment of inertia and the square of its rotational speed.