

Introduction
Splunk is a well-known log management tool. Splunk mines log from different machines in real-time and can be used to monitor, search, and analyze gathered data. It is a Big Data log management tool that can give insight from the unstructured data stored in the Splunk indexes. Splunk analytics helps turn unstructured log data into knowledge that enterprises can use to derive business value. In addition, it’s a great tool to monitor and report for making knowledgeable decisions and help in alerting so that corrective actions can be taken in case the system is underperforming.
Splunk is not also a great tool for log analytics but also being used heavily as a SEIM tool also. As a result, Splunk is placed in the leader quadrant of the Gartner Magic Quadrant. This article is to show how easy it is to use Splunk to gain insight into IT systems. How can we create reports, how can we create a dashboard, and how can we set alerts can be set? To create Splunk reports, we need to know the intermediate level of Regex. This article aims not to teach but to show how to use Splunk to get analytics out of application log files.
Tool & Methods
Data Analytics can be Descriptive, Diagnostic, Predictive, and Prescriptive. Using Splunk, a business can create reports and alerts that can help in getting these types of analytical insights. Splunk can not only gather insights from application logs but can also connect to the database and can either pull the data from it or push data to it
In this article we will be looking into 3 aspects of Business Analytics using Splunk:
- Connect to application logs, generate reports, and create a dashboard
- Connect to MS SQL Server database, mine the data, and present it in a report in the dashboard
- Set up an alert so that the IT team or business can be notified of a specific event
Connect to application logs, generate reports, and create a dashboard
For this article, in this section, we will first import a log file that has application records. Once it’s in Splunk, I will be using Regex to create reports and a dashboard. When creating a dashboard, we can create a report as an event, table, chart, single value. Event is the single transaction/ event stored in the log file. I will show single value, table, comparison, event, and charts reports. Data that this log file consists of is of a fictitious company called “Awesome Insurance Company”.
Connect to an Application and mine logfiles
First step is to setup application so that log file can be mined. Configure Splunk forwarder on app server and configure inputs.conf to make sure application log can be mined and pushed to Splunk Index. For this test though, I used the Data Inputs to import a log file.
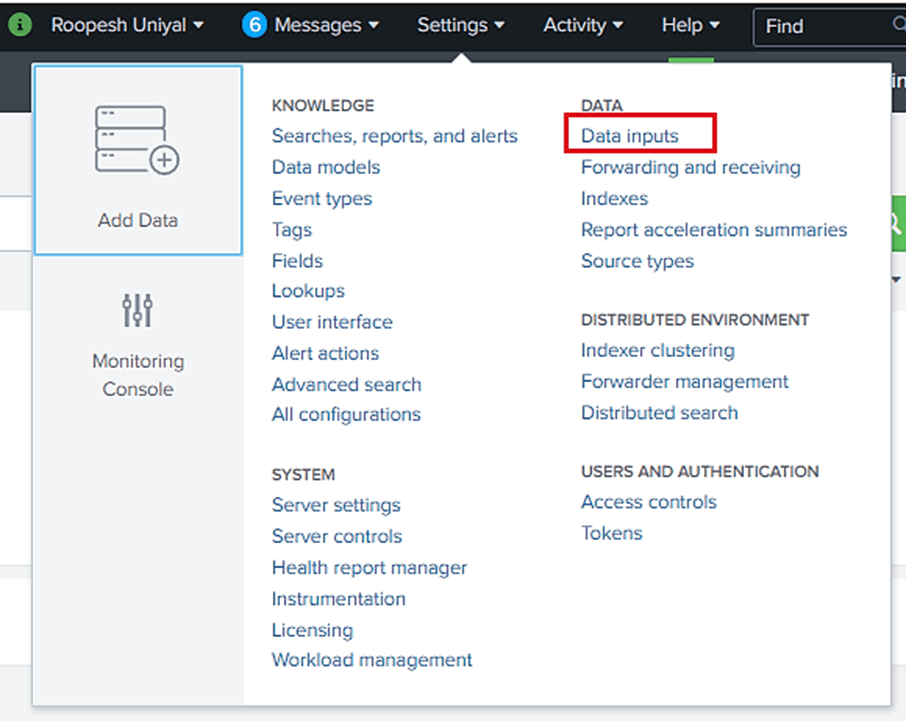
Once clicked on “Data inputs”, Data Inputs page will present mutiple option to select any of the local inputs, click on “Files & Directories”:
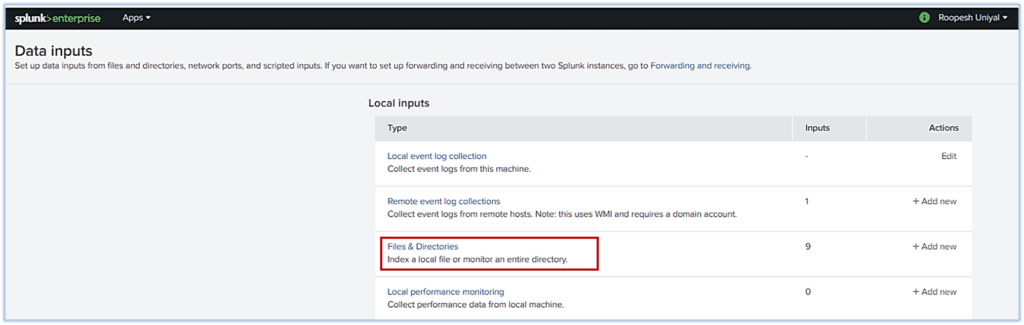
When in “Files & directories”, click on “New Local File & Directory”. Select the logfile that needs to be mined and mention if it needs to be continuously monitored or index only once.

After clicking on Next, we can use event breaks if required and then provide the name of Source Type name. Clicking next will lead to Input Settings like Index, App context, etc. Once setup is complete, we get details of the index.
| Index Details: | |
| Host: | AppServer01 |
| Source Path: | C:\Awesome\awesome_log.txt |
| Source Type: | Awesome_SourceType |
| Index: | awesome |
Create Splunk reports
We can use regex to create Splunk reports. Reports can be generated from the data stored in a Splunk Index. Below are the Report Name, Report Type, and Script that we can use to create these Splunk reports. Splunk reports can be more complex, but this article aims to show how to create different reports and present them in the Splunk dashboard.
| Report Name |
Report Type |
Splunk Script |
|---|---|---|
| Daily Approved Policies |
Table | index=awesome_index "Policy Transaction completed successfully" AND "status=approved" | rex "transactionDate=(?<Date>[^,]+)." | rex "policyType=(?<PolicyType>[^,]+)." | rex "policyAmt=(?<Amount>[^,]+)." | eval sum(Amount)=round(sum(Amount),2) | table Date PolicyType sum(Amount) |
| Policy Type | Comparisons – Pie | index=awesome_index "Claims Transaction completed successfully" | stats count by policyType |
| Claim Type | Comparisons – Pie | index=awesome_index "Policy Transaction completed successfully" | stats count by policyType |
| Approved Claims | Table | index=awesome_index "Claims Transaction completed successfully" AND "claimStatus=Approved" | rex "transactionDate=(?<Date>[^,]+)." | rex "policyType=(?<PolicyType>[^,]+)." | rex "policyAmt=(?<Amount>[^,]+)." | eval sum(Amount)=round(sum(Amount),2) | table Date PolicyType sum(Amount) |
| Policy Transaction Failure | Table | index=awesome_index Policy Account creation failed | rex "policyType=(?<PolicyType>[^,]+)." | rex "accountNumber=(?<Account>[^,]+)." | rex "reason=(?<Reason>[^,]+)." | rex "createdDate=(?<Date>[^,]+)." | rex "transactionDate=(?<Date>[^,]+)." | kv | table Date PolicyType Account Reason |
| Host wise Error |
Trends | index=awesome_index ERROR |timechart count by host |
| Application Database Data & Reconciliation |
Table | index="awesome_index" | rex "ClaimNumber="\""(?<ClaimNumber>[^"\"",]+)." | rex "claimNumber=(?<ClaimNumber>[^,]+)." | rex "PolicyNumber="\""(?<PolicyNumber>[^"\"",]+)." | rex "policyNumber=(?<PolicyNumber>[^,]+)." | rex "LOB="\""(?<PolicyType>[^"\"",]+)." | rex "policyType=(?<PolicyType>[^,]+)." | rex "Amount="\""(?<Amount>[^"\"",]+)." | rex "Status="\""(?<Status>[^"\"",]+)." | rex "claimStatus=(?<Status>[^,]+)." | rex "TransactionDate="\""(?<Date>[^"\"",]+)." | eval Date=strftime(strptime(Date, "%Y-%m-%d"),"%m-%d-%Y") | rex "transactionDate=(?<Date>[^,]+)." | rex "Reason=(?<Reason>[^,]+)." | rex "Reason=(?<Reason>[^}]+)." | rex "Reason="\""(?<Reason>[^"\"",]+)." | where isnotnull(Reason) | kv | table Date PolicyNumber PolicyType ClaimNumber Amount Status Reason source | sort – Date |
| Transaction Performance | Table | index=awesome_index | rex "in (?<respTime>\d+\.\d+) seconds.*app=(?<Application>[^,}]+)" | stats count as "Total Transactions" min(respTime) as "Min Resp Time (Sec)" max(respTime) as "Max Resp Time (Sec)" avg(respTime) as "Avg Resp Time (Sec)" by Application |
| Transaction takings more than 1 Sec | Table | index=awesome_index "Policy Transaction completed" OR "Claims Transaction completed" | rex "in (?<ResponseTime>\d+\.\d+) seconds." | where ResponseTime>.01 | rex "app=(?<Application>[^,]+)." | kv | table Application ResponseTime |
| Errors | Event – Table |
index=awesome_index "java.net.SocketException: Connection reset" Save as an Event - AI_Java_ConnectionReset index=awesome_index "ERROR user login failed" Save as an Event - AI_LoginFailed index=awesome_index "DB Connection timeout" Save as an Event - AI_DB_ConnectionTimeout index=awesome_index "OutOfMemory" Save as an Event - AI_OutOfMemory eventtype="AI_Java_ConnectionReset" OR eventtype="AI_LoginFailed" OR eventtype="AI_DB_ConnectionTimeout" OR eventtype="AI_OutOfMemory" | stats count as Total by eventtype | rename eventtype AS "Error Type" | sort-Total |
Create Splunk dashboard to present reports
Splunk provides a way to present these reports in a dashboard. Presenting reports in the dashboard helps stakeholders to know the state of business/ application in real-time. Business or Technical teams can take business decisions or corrective actions based on these real-time operational Splunk reports. Based on our requirements and scripts mentioned above, here is one quick dashboard that we can build.
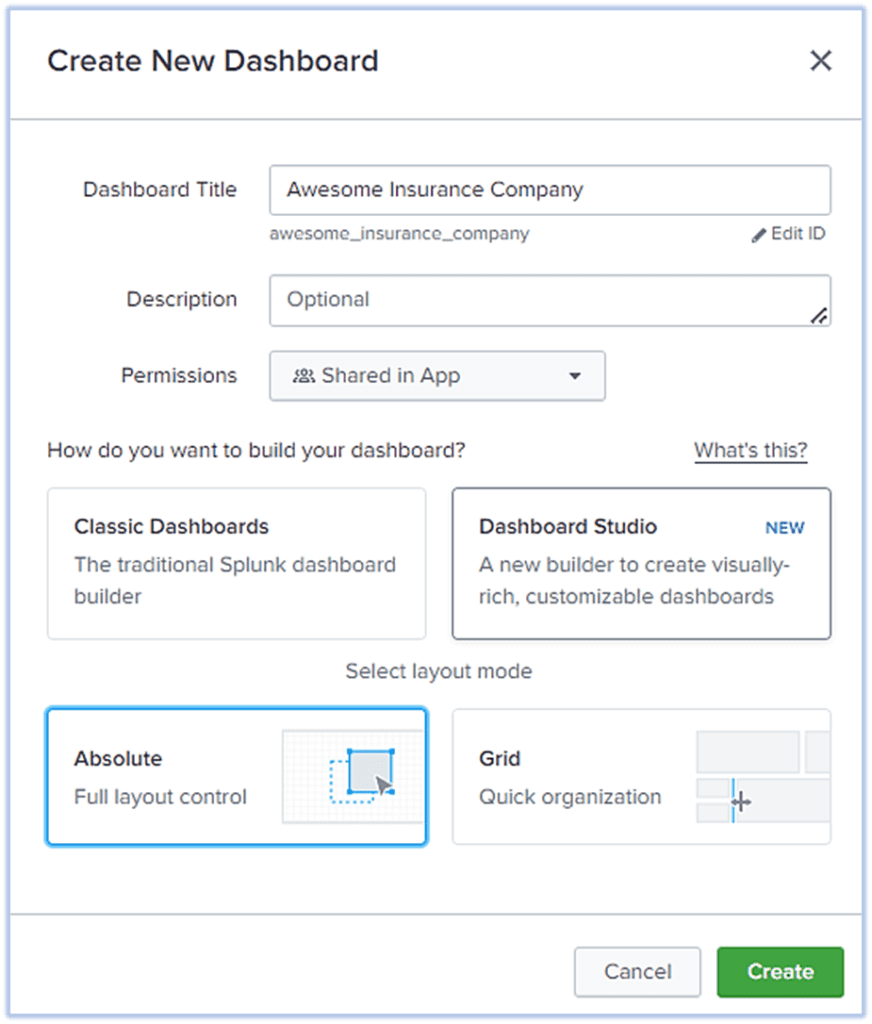
Log on to Splunk and click on Dashboards. Once on this page, click on the “Create New Dashboard” button:

Provide details for this new Dashboard and click on “Create”:
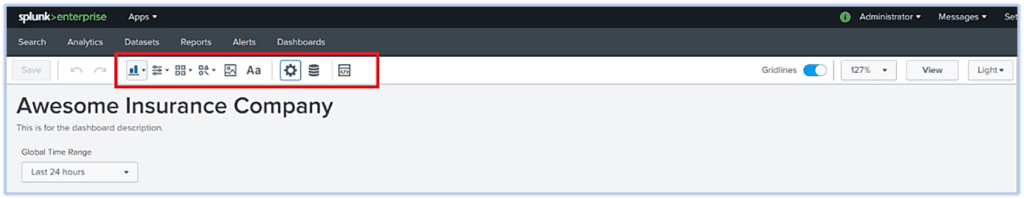
A black dashboard “Awesome Insurance Company” has been created. O top ribbon, there are different options to create and deploy reports:
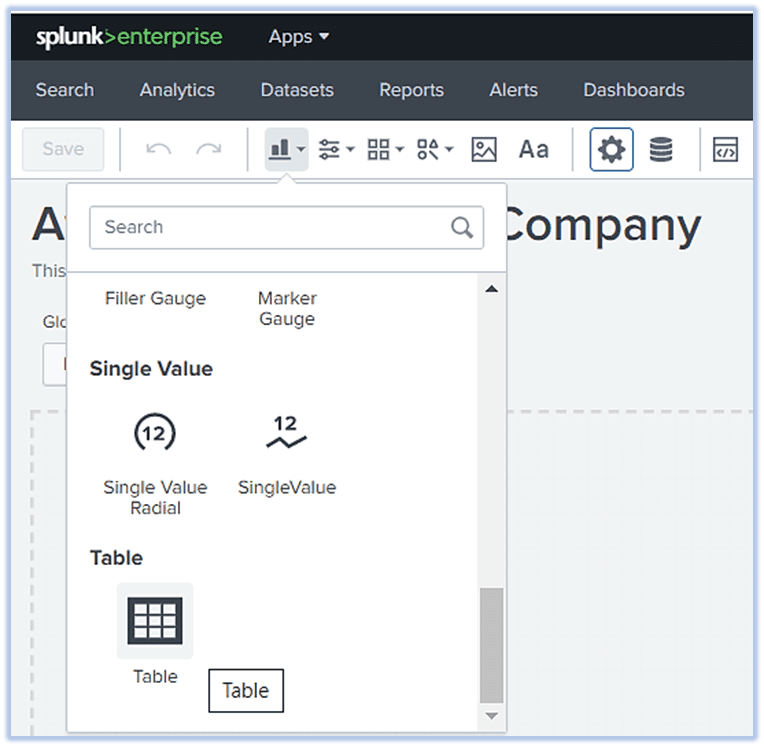
To create a report, click on the “Add Chart” button and select what type of chart you want to build. In our case, I click on “Table”:
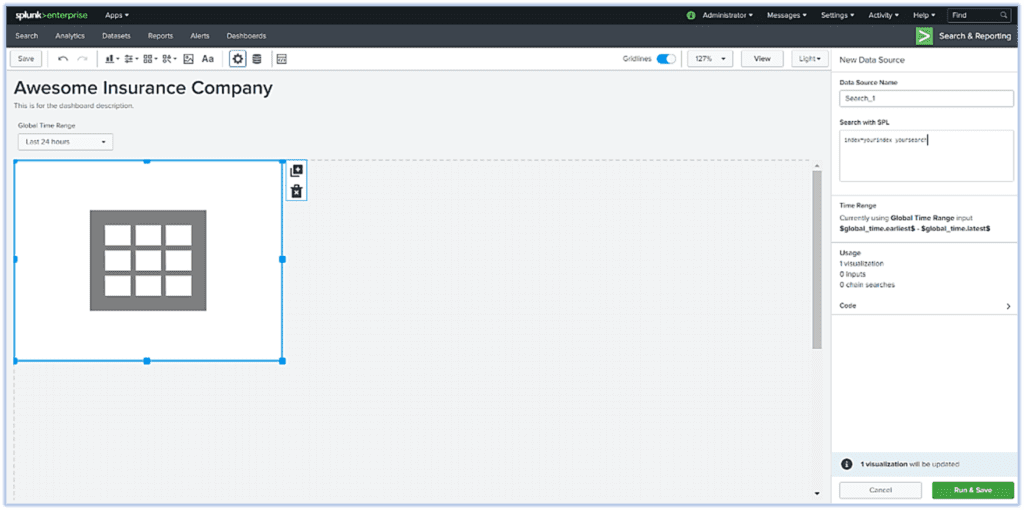
A new Table will be created on the dashboard and on the right side, we can add the Splunk report script in there, and as we add script and click on “Run & Save”, data will be populated:
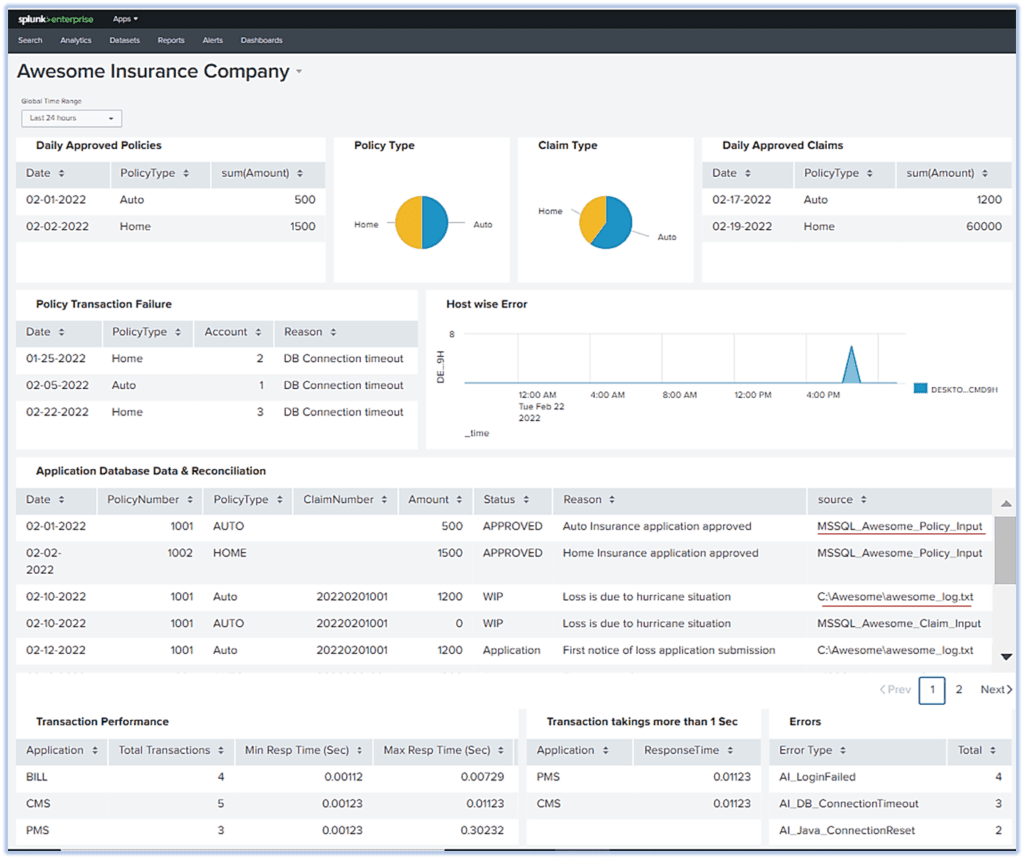
As Below is a dashboard “Awesome Insurance Company” that has these reports aligned with the time picker so that all these reports get the result for the same period.
Connect to MS SQL Server database, mine the data, and present it in a report in dashboard
If you look at the report above “Application Database Data & Reconciliation”, it is showing data not only from the application logs but from database too. Mining data from database can be very helpful in getting a wholistic idea of the system but mining data from database needs additional steps. This is achieved by using “Splunk DB Connect” to pull database data and merge it to the main index. This article is not to show how exactly Splunk DB Connect is being configured as it warrants an article in itself but will provide high level steps in creating one.
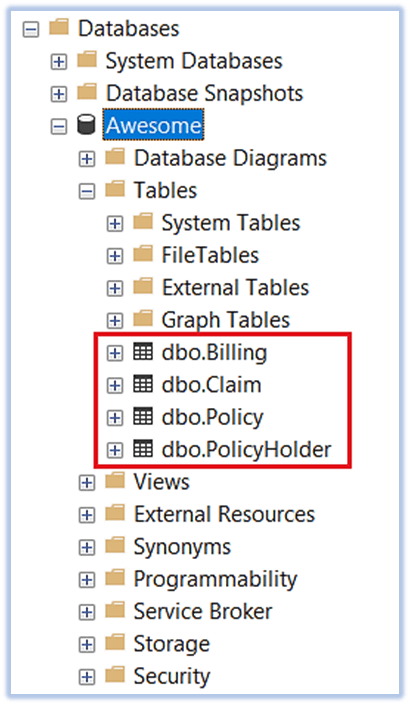
Application Database
Consider there is an application called “Awesome Insurance Core System” and it has a database called “Awesome”. There are four tables in it containing Policyholder, Policy, Claim, and Billing information. Idea here is not to show how to set up a SQL Server database or create tables correctly but to give reader an idea on how a table data that is residing in a SQL Server can be extracted.
Create SQL Server tables and insert some records to mimic a policy & claim transaction:
Mine the data using Splunk
Once the data has been populated, now we need to set up Splunk so that it can mine the database.
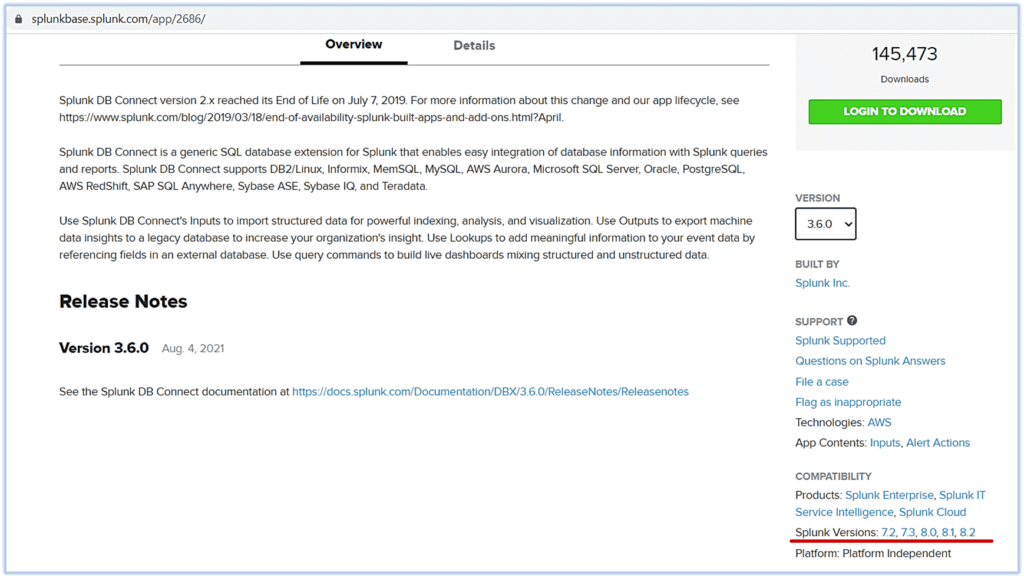
First, we need to install “Splunk DB Connect”. Splunk DB connect will help connecting to the database and either fetching or pulling data. First, download the latest version or the version that is compatible with your Splunk version. Although installation is quire easy, this article is not going to show how to install this connector.
Once Splunk DB Connect is installed as per the installation instructions, it will be presented in Splunk app:
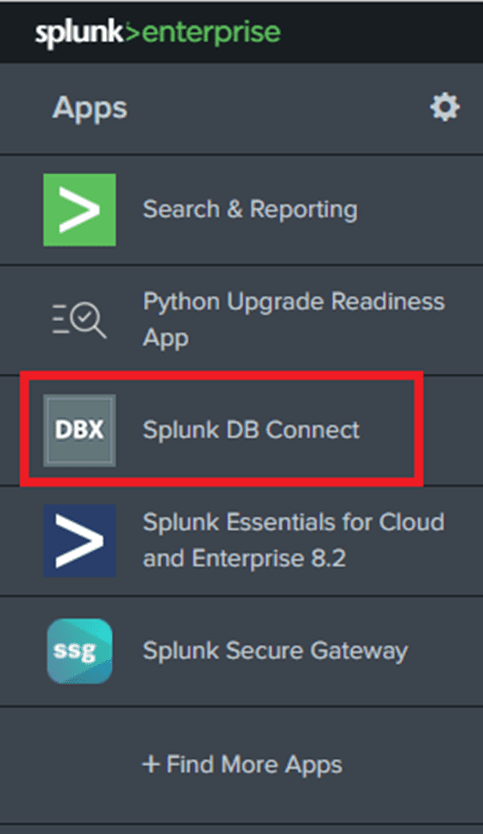
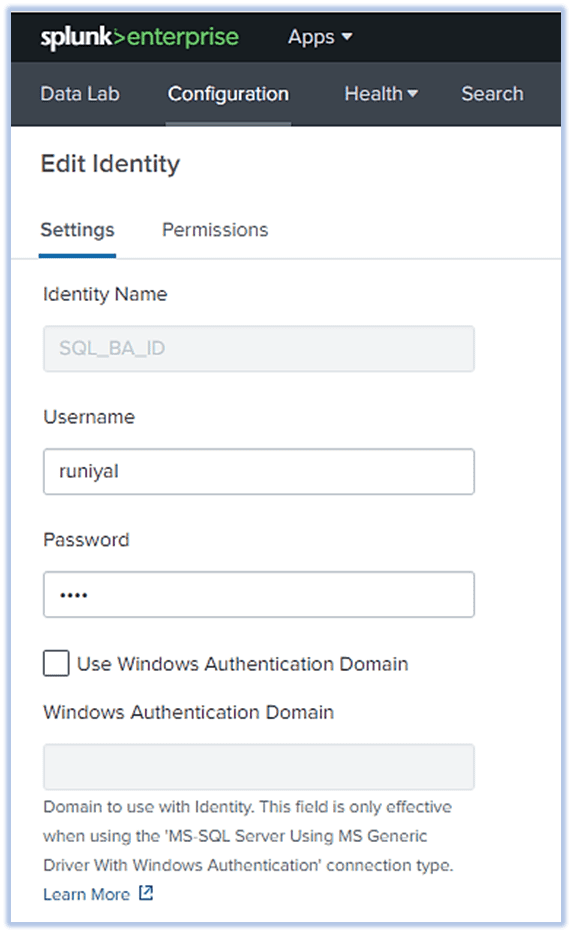
Click on the “Splunk DB Connect” and “Splunk DB Connect” app will open. Following needs to happen: Go to “Configurations” and create “Identities”. Identities is nothing but a user who is going to connect to the database.
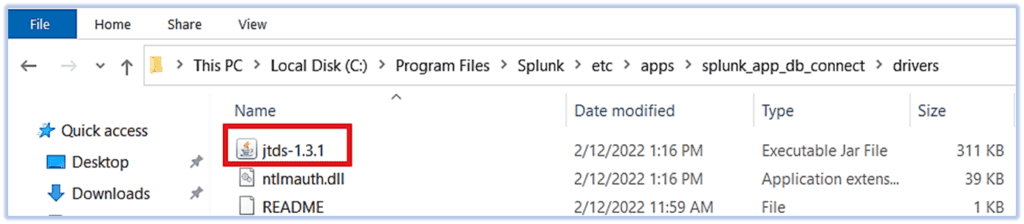
Next install appropriate SQL Server driver so that Splunk can communicate to the MS SQL Database. I installed JTDS driver for this test.
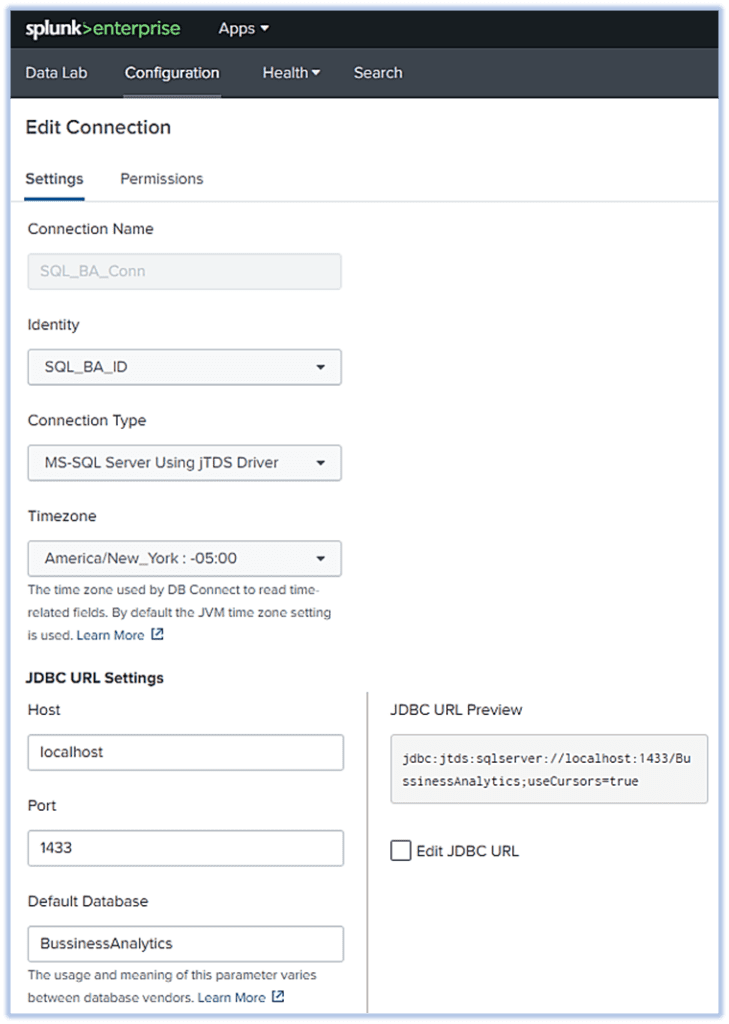
Once Identities have been created, then click on “Connections” and provide connection settings. User will select which user will be used for this connection, using which driver, the host where the DB resides, Port used by DB, and the database name. We can also provide specific permission if required. A new connection will be created once you click on “Save”.
With above three steps completed, we are ready to make connection with the DB and fetch records from the underlying tables. Click on “Data Lab” and you will see four sub-sections – Inputs, Outputs, Lookups, and SQL Explorer. Since for this test we want to fetch data from MS SQL Server database to Splunk, we will create Inputs. Now click on “New Input”:

One can set up input, use which connection to use, which catalog/ Database to connect, use which schema, and can select the tables populated underneath. Once we click on the table, SQL Editor will generate a select * query. We can update it as per our requirements. But since we want this table to be updated as we receive data, we must choose a column that our input will track. We can do this by setting values on the right pane. We can choose “Rising” for “Input Type”. The rising column will be “TransactionID” as it is a unique column and always increment by 1. We can set a value that we want Input to track from under “checkpoint value”. We can also set Query Timeout so that system can cancel fetch query if it takes x number of seconds.
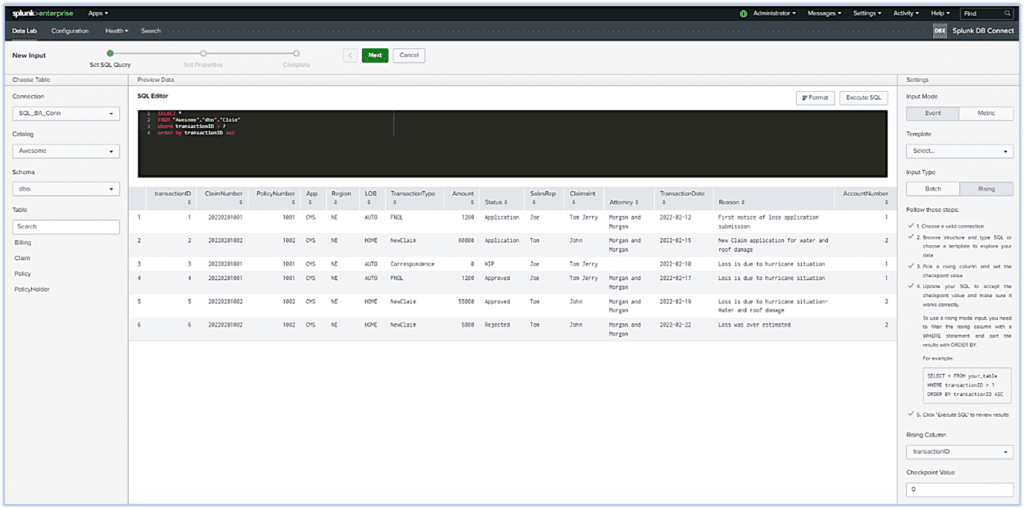
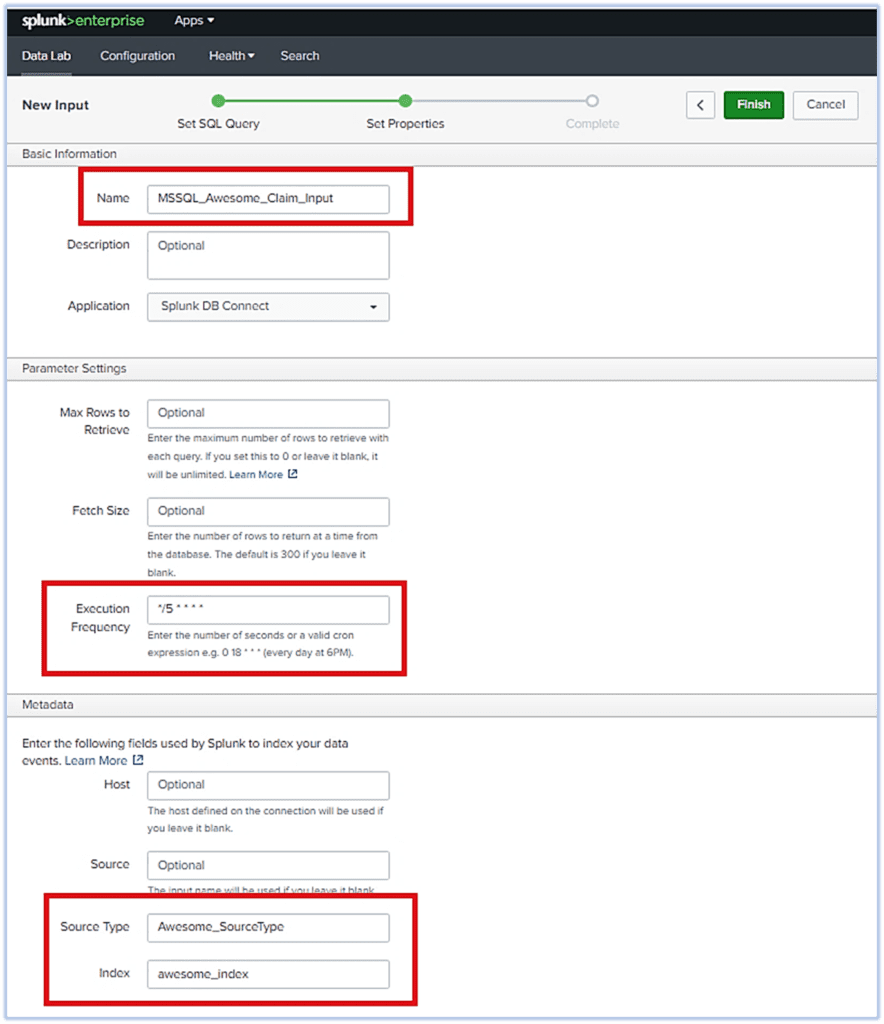
SELECT * FROM AWESOME.DBO.CLAIM WHERE TRANSACTIONID >? ORDER BY TRANSACTIONID ASC Click on “Next” and you will be presented with the “Set Properties” section. Some of the information is optional but we need to provide info like “Name”, “Execution Frequency”, “Source Type”, and “Index”. Here we direct Splunk to store all the data mined by that particular Input to this specified Index.
Once a user connects to “Finish”, the user will get an Input completion message.
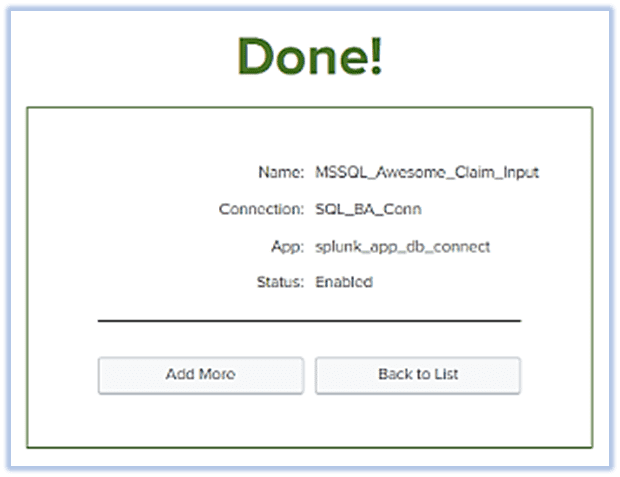
Like the input creation for the first table, we can set up Inputs for all other 3 tables also and Data will now start flowing into the assigned Index (In our case “awesome_index”).
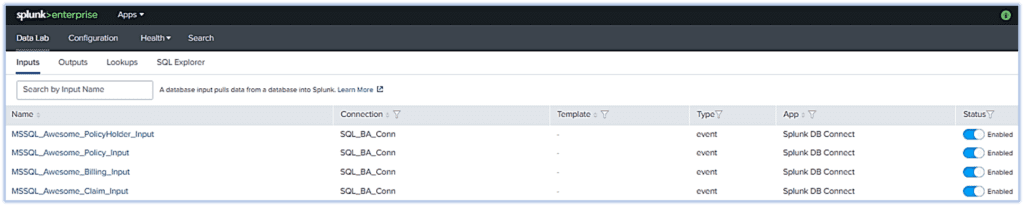
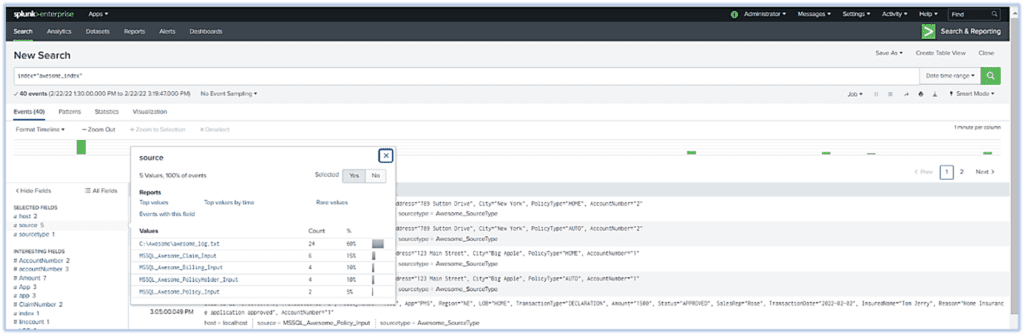
Since Application log data is already there in the index and now, we also received data from Database, we can now run the Splunk script for “Application Database Data & Reconciliation”. We can see the source type as 5 different source types, Inputs for the database tables as well as the log file.
Set up an alert so that IT team or business can be notified on a specific event
Like a report, we can set up an alert for a critical event if it occurs. We can schedule alerts for the business use case where the business would like to be alerted if there is any Claim approved for more than x amount or for a technical use case where the technical team would like to be alerted in case the system gets an error like Out of Memory, Service Unavailable, Connection Timeout, Failed login (if lots in short span), etc. The following section will show how we can set up an alert in Splunk.
Run a script for which you want to search
For this example, we are trying to look at any Claim that got approved for more than $50000. Once we get the result set then we can “Save As” Alert.
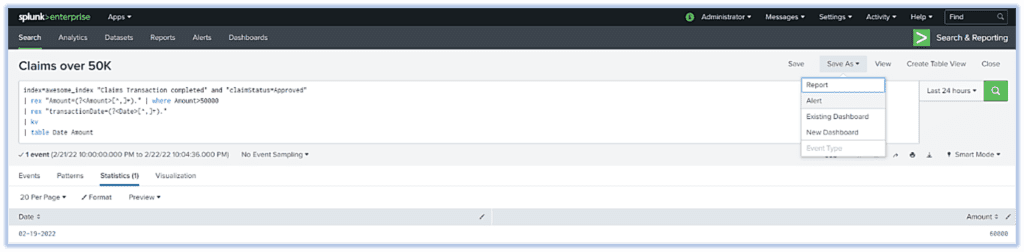
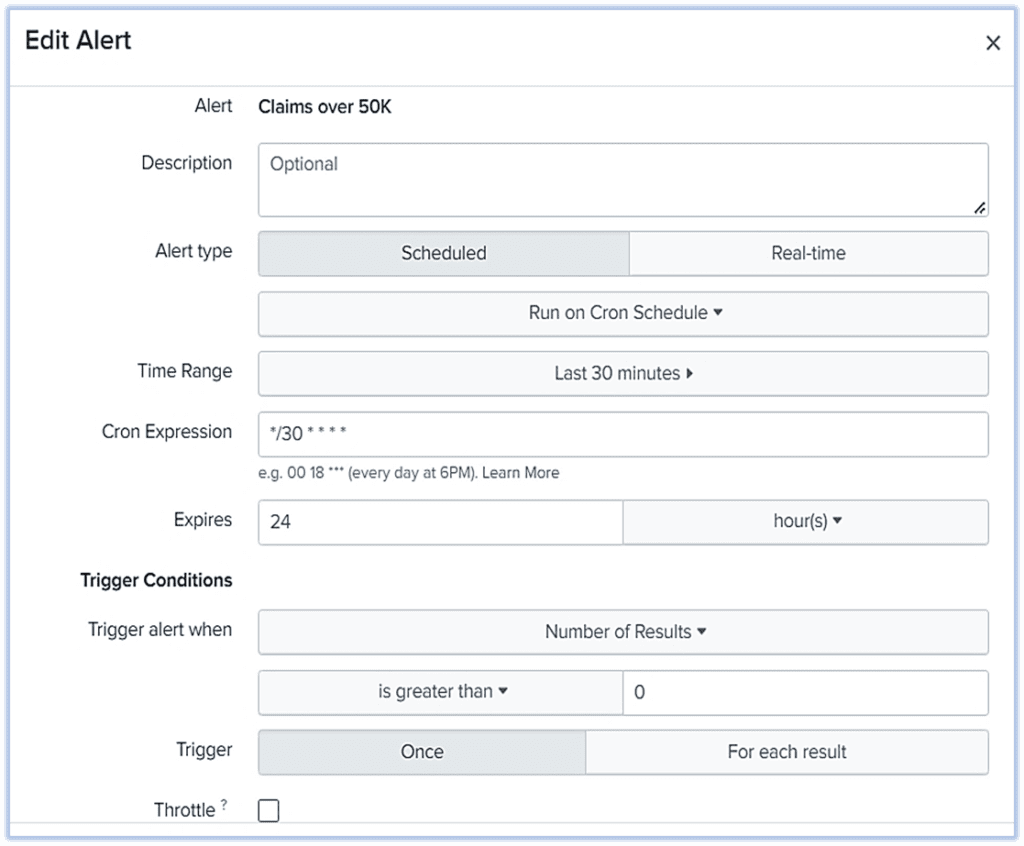
Set up Alert
Once you click on same as alert, we will be presented with the form that we need to fill out so that Alert can be scheduled. We can give a name and then schedule it as per the cron. We can also set trigger conditions.
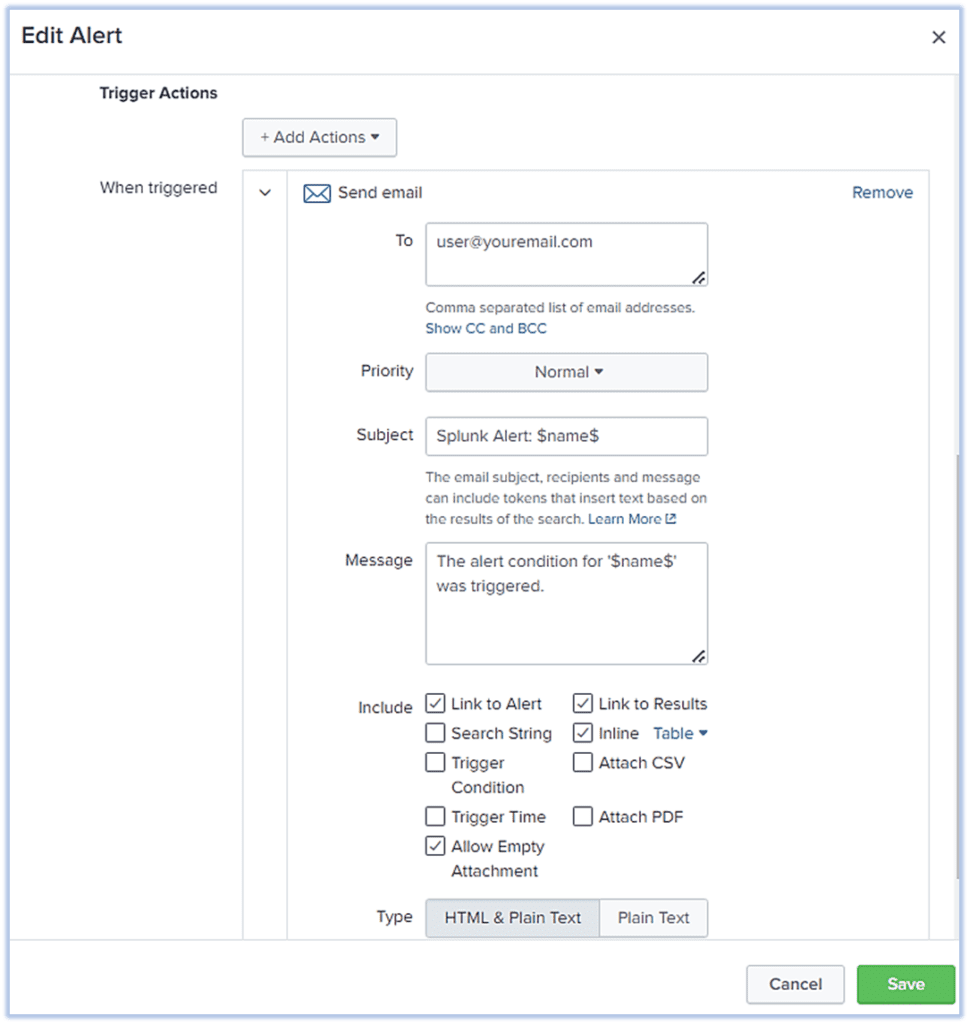
Set up Trigger Actions
After we put mandatory parameters like above, we can configure “Trigger Actions”. For this test, we will “Add Actions” like “Send email”. We can provide To emailID, message, and can add “inline table” if required. Settings like these will provide an HTML formatted email body along with the inline table having the result set from the above query.
Conclusion
Splunk provides a bigdata enabled log analytics solution. Splunk provides operational intelligence and helps enterprises and stakeholders to see the state of their systems in real-time. Although this article has presented some basic reporting, Splunk reports can also be more complex and derive more business value. Splunk can also connect to a database to create a report based on a structured database. Splunk can push log data to outside databases or copy data from outside databases to the Splunk Index. Once the data is in one place, creating reports is very easy and provides a holistic view of the application transactions. Splunk is also a great tool to alert business or IT teams so that an issue can be resolved before an issue becomes a problem. Apart from the Log Analytics solution that Splunk provides to IT, there are many other use cases like Security and DevOps where Splunk can shine. Splunk also provides a lot of connectors to other applications for ease of use. Gathering business and technology analytics from application logs and application databases using Splunk can be of great help to companies.