

Pondering a blue-sky scenario helps to clarify what a company’s long-term objectives should be. For example, say your company could pick one data-wish to come true. What wish would it be?
Off the top of your head, I’m guessing you wouldn’t answer “transform our architecture so that it’s data-centric.” But maybe that should be your answer.
Companies ultimately all want the same things when it comes to data:
- The right data
- In the right place
- In the right format
- For the right purpose
- At the right time.
Unfortunately, the likelihood that companies will ultimately get the data they want that meets all of these parameters is rather slim at the moment. Often, when it comes to data, companies “make it work.” They generate, collect, or acquire some data that can be made somewhat useful, and refine and analyze it enough to extract some value from it. And they manage the kinds of data using a rough data lifecycle approach to keep extracting that value from it.
Part of the reason for this status quo is that creating and managing quality data is hard work. For most, it’s harder than it should be.
Most companies haven’t found, believed in, or focused on a way to make the work easier. But some have made easier data integration, quality, and management work possible. Ask me for a list of case studies if you’re interested.
Observational bias and the data quality challenge
When I was a research fellow at the Center for Technology and Innovation at PwC back in 2009, I had an ex-Stanford Research Institute boss who always started with first principles and blue-sky scenarios. He taught us to do divergent research first, then convergent.
In 2009, he asked us to research what the challenge of business intelligence was. After research, we decided the biggest challenge was data integration, true integration. After more in-depth research, we agreed the best solution to the integration problem was web semantics, i.e., smarter data modeled using standard, semantic graphs. Today they’re called knowledge graphs.
If you consider all the types of bias that occur in data and how it’s analyzed, observational bias is one of the most common and pervasive. You don’t just need a lot of observations to solve that kind of bias problem. You need a fuller picture of the problem landscape to find the right questions to ask and be open to how to answer those questions. For that reason, discoverability and richness in data is key.
Also, the answer can’t be supplied with quantitative data alone. Qualitative data often provides a means of capturing context for what data you should collect, and how.
One of the interviews we conducted in 2009 was with Doug Lenat, head of Cycorp. Doug described the observational bias problem this way: You’re looking for your keys under the lamppost because that’s where the light is. The challenge is to put the light in more places, with the help of smarter data and large-scale integration and interoperation.
Ten ways to simplify data quality and sharing efforts
True data quality simplification requires a transformation of both code and data because the two are inextricably linked. Code sprawl and data siloing both imply bad habits that should be the exception, rather than the norm.
- Transform your data architecture. Today’s “modern” architectures tend to carry a load of legacy baggage from previous generations. It’s best to sidestep this baggage and build a parallel system that innovates at the data layer.
- Design to eliminate code waste and data duplication. Code that should be reusable is trapped in applications.
- Think knowledge graphs instead of data lakehouses. Quality data is knowledge and logic enriched. All types of heterogeneous data can be brought together and managed via knowledge graphs.
- Make zero-copy integration a goal. When it comes to new projects, assume locally owned and controlled data that’s reusable at the source. Design apps to use others’ data. Share data via named graphs rather than APIs. That’s the SOLID approach Tim Berners-Lee envisions, one that also enables zero-copy integration and management.
- Focus on semantics up front, and refine semantics in mid-stream. Semantics is the art and science of meaning. When it comes to digital data, shared semantics forms a bridge between users and between machines and users. Smart data includes semantics, which allows a fuller picture of the problem and the solution to be painted in terms of the environment.
- Integrate using graphs instead of tables only. Graphs are well-articulated and easily extensible. Table-to-graph conversion is straightforward.
- Expose and articulate relationships between entities. Ironically, most relational databases treat relationships as second-class entities. Thinking and working in graphs makes it possible to contextualize your data.
- Use an extensible graph data model as the mother of your data children for integration. Other models are useful for other purposes, not large-scale integration and interoperation.
- Rationalize your SaaSes and internal applications. Adding more SaaSes to your subscription list adds unnecessary complexity. Do you really want to struggle to use your own data?
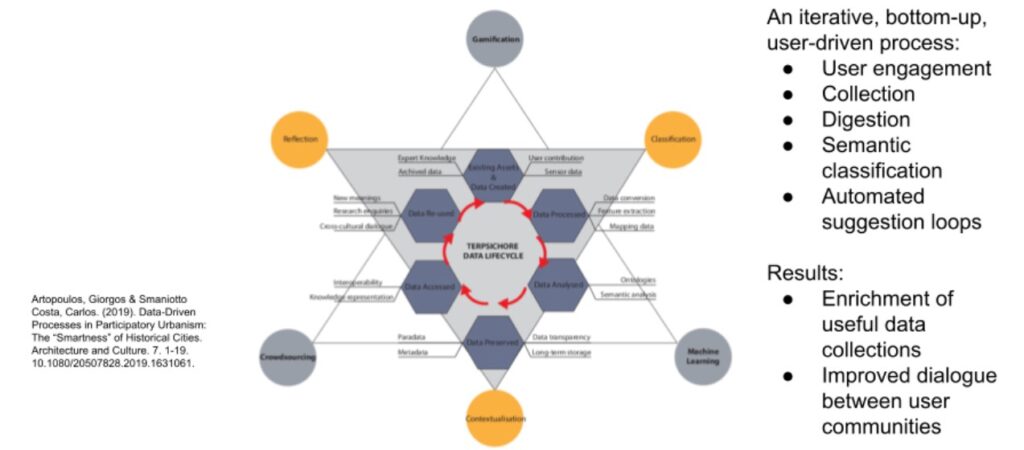
- Map your future organization to a semantic data lifecycle. A data lifecycle such as Terpsichore, for example, suggests a need to commit to smart, contextualized data and contextual computing–what DARPA calls the Third Wave of AI.