Why Python?
Python is a multipurpose programming language and widely used for Data Science, which is termed as the sexiest job of this century. Data Scientist mine thru the large dataset to gain insight and make meaningful data driven decisions. Python is used as general purposed programming language and used for Web Development, Networking, Scientific computing etc. We will be discussing further about the series of awesome libraries in python such as numpy, scipy & pandas for data manipulation & wrangling and matplotlib, seaborn & bokeh for data visualization.
So Python & R is just used as a tool for data science but for being a data scientist you need to know more about the statistical & mathematical aspects of the data and on top of everything a good domain knowledge is must.
In my this post I will pave the path for learning Data science with Python and will share some useful resources for learning it. Remember learning for data science is time taking stuff and cannot be completed in a month or so and it requires a lot of practice, dedication and self confidence. So never giveup and happy learning.
STEP 1: LEARNING THE BASICS FOR PYTHON
Python is an easy to start language but to master the idioms takes time like any other language. So as a novice first you need to understand all the basics for the language and a good start would be to follow these tutorials:
Once you have completed this tutorial then it’s time to take a bigger leap and understands the more complex and real time python usage and best bet would be reading few books:
Books:
a) Learn Python the Hardway
b) Automate Boring Stuffs with Python
STEP 2: BASIC STATISTICS & MATHEMATICS
Would highly recommend learning statistics with a heavy focus on coding up examples, preferably in Python or R.
Most famous are the Statistical Learning series. It’s a great primer on statistical modeling / machine learning with applications in R. Read ISLR first before you jump to ESLR.
a) An Introduction to Statistical Learning
b) The Elements of Statistical Learning
If you want something with a Python heavy, Check out this book “Think Stats”
This a great MOOC’s to learn basic statistics needed for Data science:
— Statistics with R Specialization
Brush up your high school statistical & mathematical knowledge using this awesome Khan’s academy series:
STEP 3: PYTHON FOR DATA ANALYSIS
Once you are done with Step 1 & Step 2 then it’s time to get your hands dirty with some real stuffs, First you need to install the Anaconda
Advantages of Anaconda:
a) User level install of the version of python you want
b) Able to install/update packages completely independent of system libraries or admin privileges
c) Comes with numpy, scipy, PyQt, spyder IDE, etc. or in minimal / alacarte version (miniconda) where you can install what you want, when you need it.
These are the tool which comes with Anaconda:
a) Jupyter notebook : The IPython Notebook is now known as the Jupyter Notebook. It is an interactive computational environment, in which you can combine code execution, rich text, mathematics, plots and rich media.
you can use this notebook locally for data analysis and plotting graphs and visualizing the data and eventually sharing it
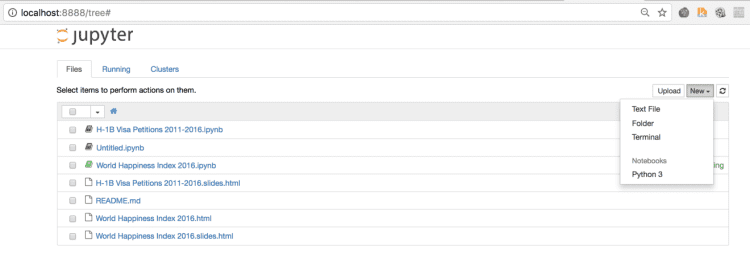
- After installing Anaconda open ipython notebook from Terminal:
- Notebook opens in your default browser:
- Execute Python code in Notebook cell
b) Numpy
NumPy is the fundamental package for scientific computing with Python. It contains among other things:
1) a powerful N-dimensional array object
2) sophisticated (broadcasting) functions
3) tools for integrating C/C++ and Fortran code
4) useful linear algebra, Fourier transform, and random number capabilities
URL:Numpy
c) Pandas
pandas is a software library written for the Python programming language for data manipulation and analysis
URL: Pandas
Book: Python for Data Analysis by Wes Mckiney
d) Matplotlib
Matplotlib is a Python 2D plotting library which produces publication quality figures in a variety of hardcopy formats and interactive environments across platforms. Matplotlib can be used in Python scripts, the Python and IPython shell, the jupyter notebook, web application servers, and four graphical user interface toolkits.
URL: Matplotlib
e) Seaborn
Seaborn is a Python visualization library based on matplotlib. It provides a high-level interface for drawing attractive statistical graphics
URL: Seaborn
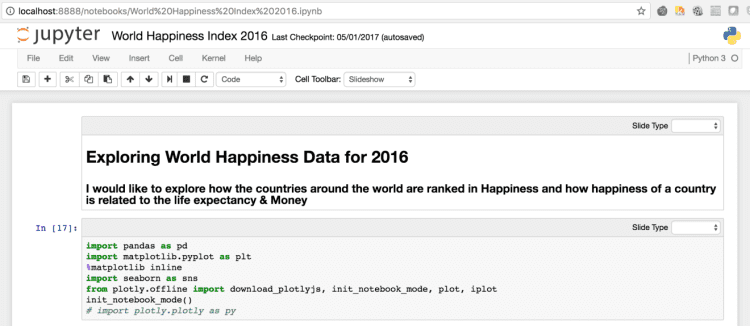
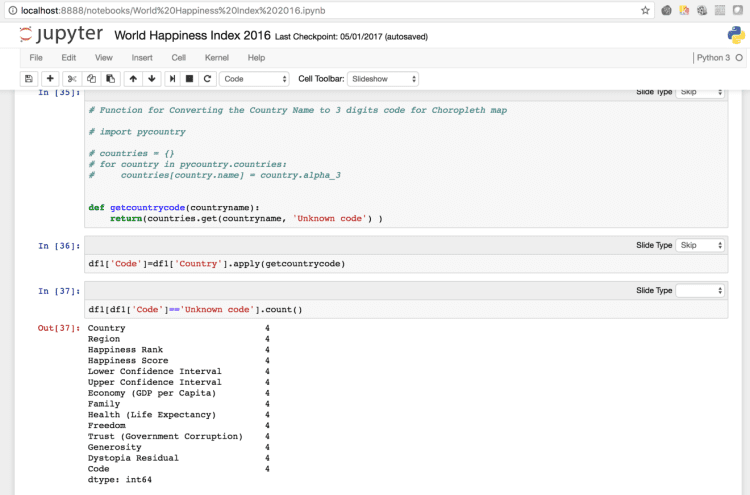
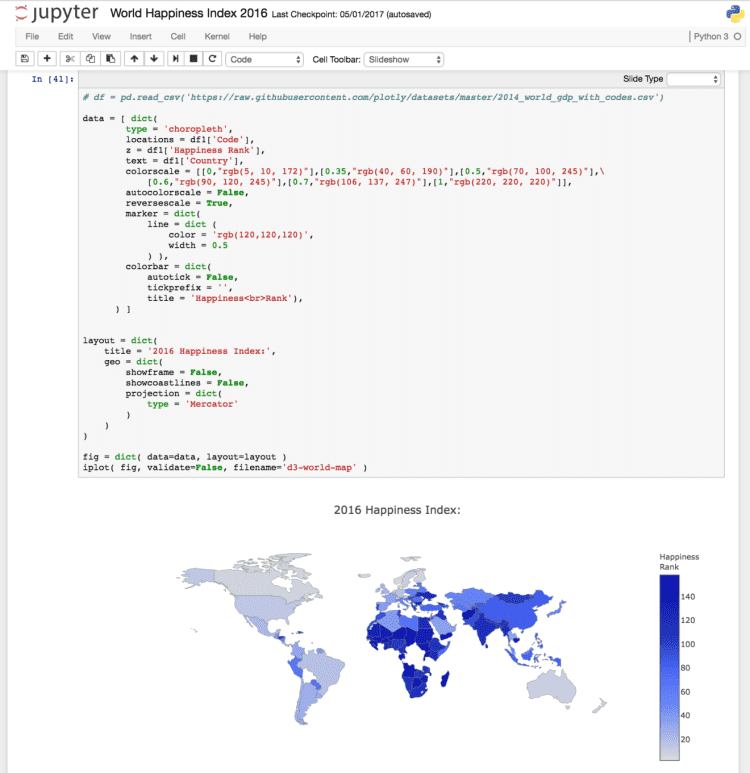
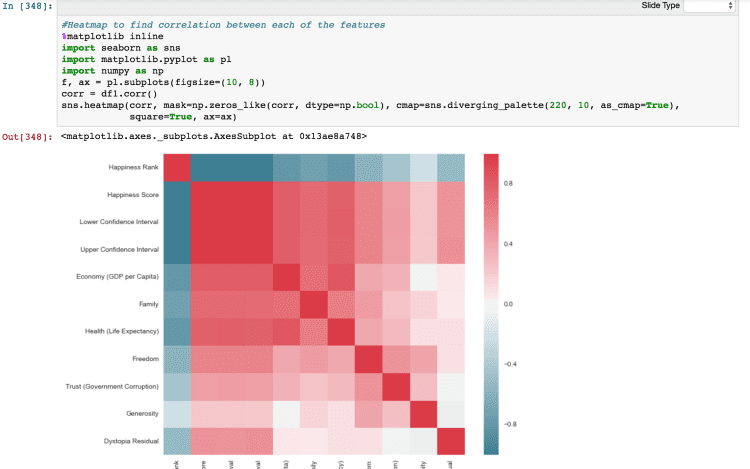
Check the below figures of Jupyter notebook which is using all of the above libraries for Data Analysis:
a) Data Import using Pandas:
b) Data Analysis & Cleaning:
c) Plotting Graphs using matplotlib & Seaborn
d) Plotting Boxplot, Bar Graphs & Heatmaps in Jupyter notebook
STEP 4: MACHINE LEARNING
Machine learning is the science of getting computers to act without being explicitly programmed. The machine learns from the large set of training data and helps to predict or classify on the new dataset.
it is classified into following two categroies:
(i) Supervised learning (parametric/non-parametric algorithms, support vector machines, kernels, neural networks).
(ii) Unsupervised learning (clustering, dimensionality reduction, recommender systems, deep learning).
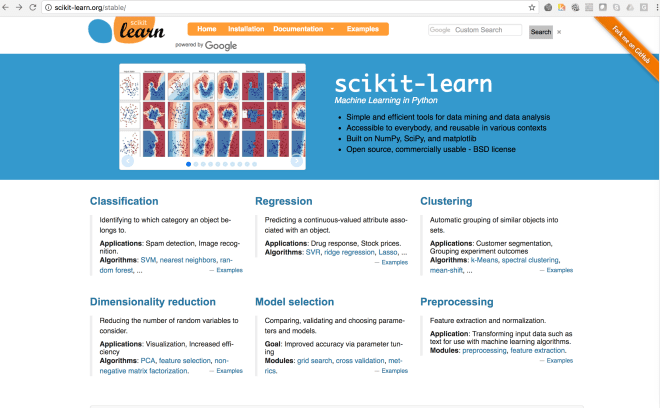
Install Python Scikit Learn Library for practicing Machine Learning in Jupyter Notebook. It has very good Documentation to start with:
Best MOOC’s to start with:
a) Stanford Machine Learning by Andrew Ng
b) Intro to Machine Learning by Udacity
There are abundant book to read on this subject and all are well written so i don’t want to specifically recommend any book. All books are equally good to read and follow.
STEP 5: PRACTICE PRACTICE & PRACTICE
Last but not the least practice and hard work is the key so many a times i have seen questions on Reddit & Quora that from where I can get the open source data for our Analysis. We are in 2017 and there is abundant data all around, Just you need to pick the data and start playing around with it. This is the place where you can learn on your own and view kernels to see some of the best data scientists works.
To read original post, click here


