
A new competition is posted on Kaggle, and the prize is $1.2 Million. Here we provide some help about solving this new problem: improving home value estimates, sponsored by Zillow.
We have published in the past about home value forecasting, see here, and also .here and here. In this article, I provide specific advice related to this new competition, to anyone interested in competing or curious about home value forecasting. Additional advice can be obtained by contacting me. More specifically, I provide here high-level advice, rather than about selecting specific statistical models or algorithms, though I also discuss algorithm selection in the last section. I believe that designing sound (usually compound) metrics, assessing data quality and taking it into account, as well as finding external data sources to get a competitive edge and for cross-validation, is even more important than the purely statistical modeling aspects.
1. First, let’s discuss the data
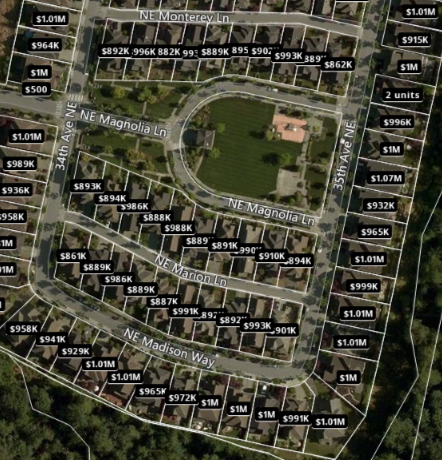
Where I live (see picture below – this is close to Zillow’s headquarters) all neighboring houses are valued very close to $1.0 million. There are however, significant differences: some lots are much bigger, home sizes vary from 2,600 to 3,100 square feet, and some houses have a great view. These differences are not well reflected in the home values, even though Zillow has access to some of this data.
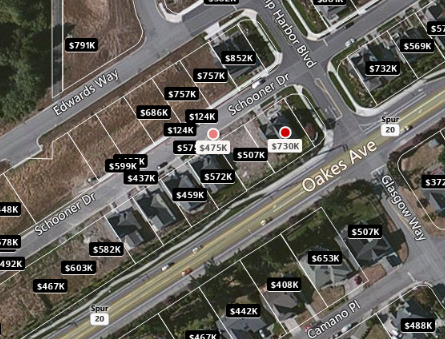
 Regarding my vacation home (picture below) there are huge variations (due mostly to home size and view) and the true (real) value ranges from $500k to $1.5 million. The market is much less fluid. But some spots are erroneously listed at $124k: if you look at the aerial picture below, some lots do not have a home, while in reality the house was built and sold two years ago. This might affect the estimated value of neighboring houses, if Zillow does not discriminate between lots (not built) and homes: you would think that the main factor in Zillow’s model is the value of neighboring homes with known value (e.g. following a recent sale.)
So the first questions are:
- How do I get more accurate data?
- How can I rely on Zillow data to further improve Zillow estimates?
We answer these questions in the next section.
2. Leveraging available data, and getting additional data
It is possible that Zillow is currently conservative in its home value estimates, putting too much emphasis on the average value in the close neighborhood of the target home, and not enough in the home features, as in the top figure. If this is the case, an easy improvement consists of increasing value differences between adjacent homes, by boosting the importance of lot area and square footage in locations that have very homogeneous Zillow value estimates.
Getting competitor data about home values, for instance from Trulia, and blending it with Zillow data, could help improve predictions. Such data can be obtained with a web crawler. Indeed, with distributed crawling, one could easily extract data for more than 100 million homes, covering most of the US market. Other data sources to consider includes
- Demographics, education level, unemployment and household income data per zipcode
- Foreclosure reports
- Interest rates if historical data is of any importance (unlikely to be the case here)
- Crime data and school ratings
- Weather data, correlated with home values
- MLS data including number of properties listed (for sale) in any area
- Price per square foot in any area
3. Potential metrics to consider
Many statisticians are just happy to work with the metrics found in the data. However, deriving more complex metrics from the initial features (not to mention obtaining external data sources and thus additional features or ‘control’ features), can prove very beneficial. The process of deriving complex metrics from base metrics is like building complex molecules using basic atoms.
In this case, I suggest computing home values at some aggregated level called bin or bucket Here a bin is possibly a zipcode, as a lot of data is available at the zipcode level. Then for each individual home, compute an estimate based on the bin average, and other metrics such as recent sales price for neighboring homes, trend indicator for the bin in question (using time series analysis), and home features such as school rating, square footage, number of bedrooms, 2- or 3-car garage, lot area, view or not, fireplace(s), and when the home was built. Crime stats, household income and demographics are already factored in at the bin level.
Some decay function should be used to lower the impact of sales price older than a few months old, especially in hot markets. If possible, having an idea of the home mix in the neighborhood in question (number of investment properties, family homes, vacation homes, turn over, rentals) can help further refine the predictions. Seasonality is also an important part of the mix. If possible, include property tax data in your model. Differences between listed price and actual price when sold (if available,) can help you compute trends at the zipcode level. Same with increases or decreases in ‘time in market’ (time elapsed between being listed, and being sold or pulled from the market.)
4. Model selection and performance
With just a few (properly binned) features, a simple predictive algorithm such as HDT (Hidden Decision Trees – a combination of multiple decision trees and special regression) can work well, for homes in zipcodes (or buckets of zipcodes) with 200+ homes with recent historical sales price. This should cover most urban areas. For smaller zipcodes, you might consider bundling them by county. The strength of HDT is its robustness and if well executed, its ability to work for a long time period with little maintenance. HDT that work with many features are described here. HDT allows you to easily compute CI (confidence intervals) for your estimate, based on bin (zipcode) values.
However, chances are that performance, to assess the winner among all competitors, will be based on immediate, present data, just like with any POC (proof of concept.) If that is the case, a more unstable model might work well to eventually collect the $1.2 million prize. It is critical to know how performance will be assessed, and to do proper cross-validation no matter what model you use. Cross-validation consists of estimating the value of homes with known (recent) sales price, that are not in your training set, or even better, located in a zipcode outside your training set. It would be a good idea to use at least 50% of all zipcodes in your training set, for cross-validation purposes, assuming you have access to this relatively ‘big data’. And having a substantial proportion of zipcodes with full 5-year worth of historical data (not just sampled homes) would be great, as it would help you assess how well you can make local predictions based on a sample rather than on comprehensive data. If you only have access to a sample, make sure that it is not biased, and discuss the sampling procedure with the data provider.
It is important to know how the performance metrics (used to determine the winner) handle outlier data or volatile zipcodes. If it is just a straight average of square of errors, you might need a bit of chance to win the competition, in addition to having a strong methodology — though being good at predicting the value of expensive homes will also help in this case. Regardless, I would definitely stay away from classic linear models, unless you make them more robust by putting constraints on model parameters (as in the Lasso or Jackknife regression.)
Finally, as you can judge from this article, it helps to have domain expertise to win such competitions — at least to build scalable solutions that will work for a long time. Hopefully, I shared all my expertise with you, in this article.
DSC Resources
- Services: Hire a Data Scientist | Search DSC | Classifieds | Find a Job
- Contributors: Post a Blog | Ask a Question
- Follow us: @DataScienceCtrl | @AnalyticBridge
Popular Articles