
Best Subset Regression method can be used to create a best-fitting regression model. This technique of model building helps to identify which predictor (independent) variables should be included in a multiple regression model(MLR).
This method comprises of scrutinizing all of the models created from all possible permutation combination of predictor variables. This technique uses the R Squared value to check for the best model. Considering the level of complexity involved in creating such models it will not be an easy or a fun task to perform this method without using a statistical software program. Henceforth, today we will learn how this can be performed within a very popular statistical software called as Minitab.
Now that we are aware of the basic concept of this regression technique let us understand it’s mechanics.
Best subset regression is an automated process that suggests best fitting model based on the predictors specified by its user. The basic approach is to go with the smallest subset that fulfills certain statistical rules.
What Statistical Rules to look for?
The Statistics R squared, adjusted R squared, predicted R squared, Mallow’s Cp and s (Square root of MSE) can be used to compare the results and these statistics are generated by the best subset procedure.
Usually, one would go with the subsets that provide the largest r-squared value. However, R-squared value tends to increase with the size of the subset. Example, the best 5 predictor model will always have better results compared to a 4 predictor model. Therefore, it is recommended to use R-squared value when looking or comparing a similar size model.
Use adjusted R squared with Mallow’s Cp to compare models with different number of predictors. Selecting a model with a higher adjusted R squared is as good as choosing a model with the smallest mean square of the error (MSE).
Mallow’s Cp, the smallest this statistic the better the results, this means if the Mallow’s Cp value is approximately equal to the number of parameters in the model it is considered as precise or has small variance in estimating the regression coefficients and predicting the response. It is observed that models that lack fit have larger Mallow’s Cp value than the number of parameters.
To ensure that the model has the best fit on the specific data it is advisable that the model is used on the new similar data set. This will help to ensure that the model works on the other data set collect in the same way.
Looking at the results
Below is the table that shows which model will predict Member Dissatisfaction based on the topics that they called about.
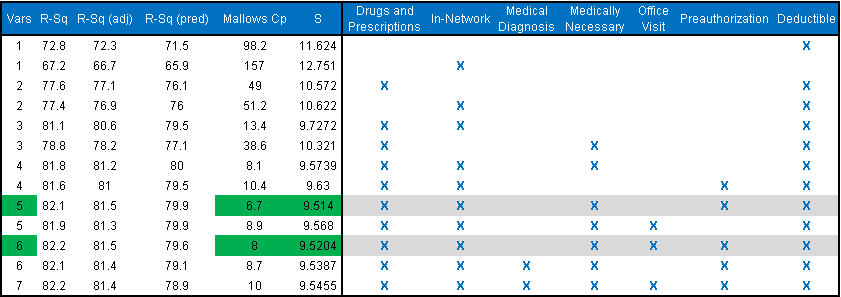
The above grid clearly shows the attributes that we talked at the start of this article to pick the best fitting model. Model with 5 & 6 variables looks better compared to the other models with the higher R squared values.
Always Remember:
- RSQ Adj: The higher the better
- Mallows Cp: The Lower the better
- Mean Squared Error (S): The Lower the better
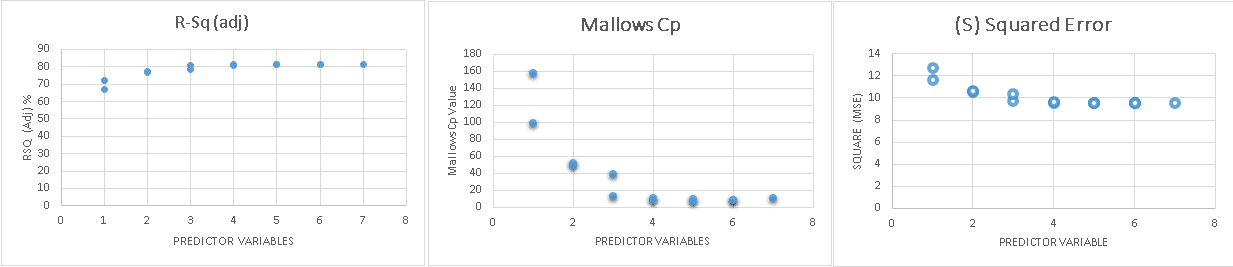
The below graphs shows how the R-Squared, S(Mean Squared Error) and Mallow’s Cp values behaves when the predictors increases or decreases.
Conclusion:
The best subset regression technique helps to identify the best predictors for a better performing models to predict accurate outcomes. However, before we choose a model it will be a great idea to check if the model is not violating any regression assumptions using residual plots and diagnostic tests.