
As per the largest market research firm MarketsandMarkets the speech analytics industry will grow to USD 1.60 billion by 2020 at a Compound Annual Growth Rate (CAGR) of 22% from 2015 to 2020. Today the omnichannel world consists of voice, email, chat, social channels, and surveys, and each channel has its own importance.
Therefore, it becomes inevitable for any customer centric organization to ignore the information that can be glean out of these customer interactions.
This article talks about some cutting edge usage of Speech Analytics output coupled up with a computerized mathematical technique that allows organizations to account for risk which is called as Monte Carlo simulation. For the purposes of this article I will be focusing on the healthcare industry which has reported (The Economist May,31,2014) a staggering $275 billion swindle.
To use this technique (Monte Carlo simulation) in conjunction with the Speech Analytics output we will use the “Stochastic Model” for the simulation which involves probability or randomness.
Application of Monte Carlo Simulation to identify probability of fraud by Service Providers
The expected output of this simulation is to identify the likelihood of a fraudulent activity based on the key customer interaction that indicates potential “Fraud Outcomes”.
Identifying the fraudulent interactions
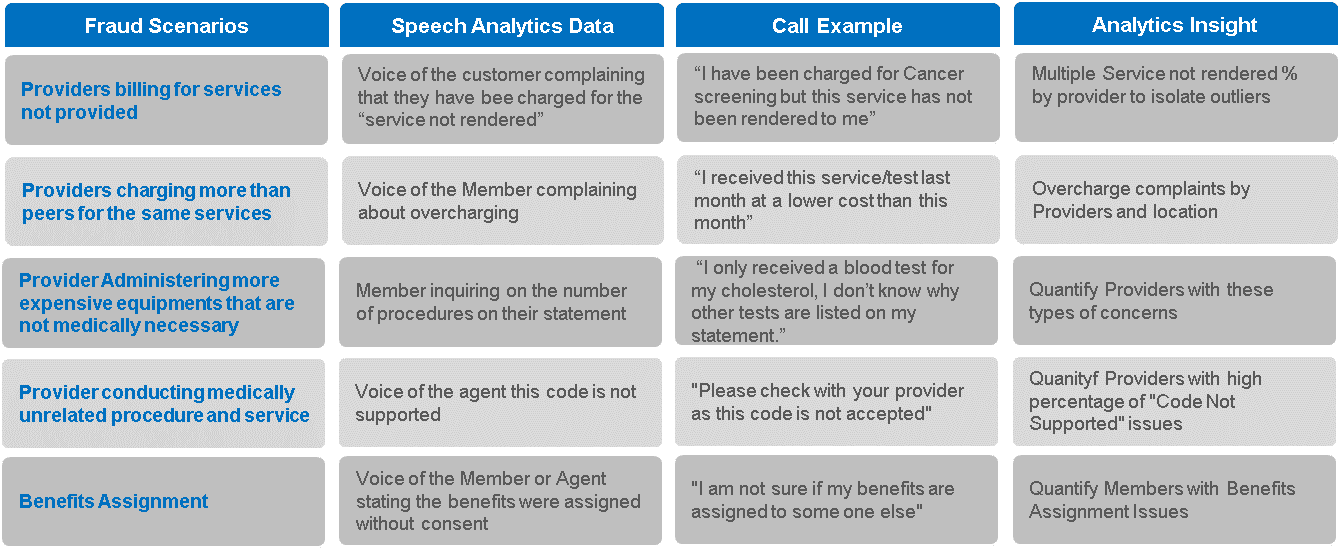
As we know that speech analytics allows its users to query the media files to identify the emerging topics. The above scenarios can be created within any speech analytics application. The user can also utilize the provider related metadata (additional information about a particular customer interaction) to understand the interaction distribution of the above scenarios by a particular provider.
How it works? Creating the Model
Scenario 1 + Scenario 2 + Scenario 3 + Scenario 4 + Scenario 5 = Fraud?
Let’s say we have over a million customer interactions with a combination of 5 scenarios (refer to the scenario grid), and we arbitrarily identify the interactions to decide if that interaction has a high likelihood of being a fraudulent scenario. No two scenarios will have precisely the same number of fraud manifestations. However, if we have an idea of the range of occurrences for each situation, then we can create a Monte Carlo simulation to better understand the probability of a fraud scenario.
The image below shows the simulation that I created in Excel that illustrates how the model was created using 1000 fraud simulations where each simulation is equally likely to happen.
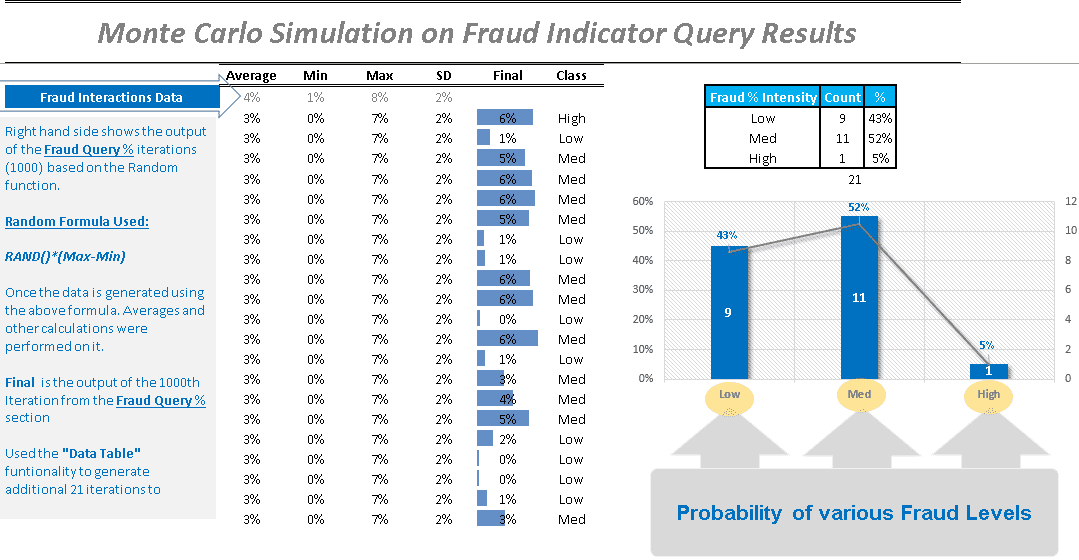
The above simulation was done for multiple providers based on their fraud scenario % (it will be advisable to pick the outliers by keeping the fraud indicator scenario % in mind). Once the simulation for the top provider were created. I was able to showcase the providers who are prone to get into fraud related discussions with their customers.
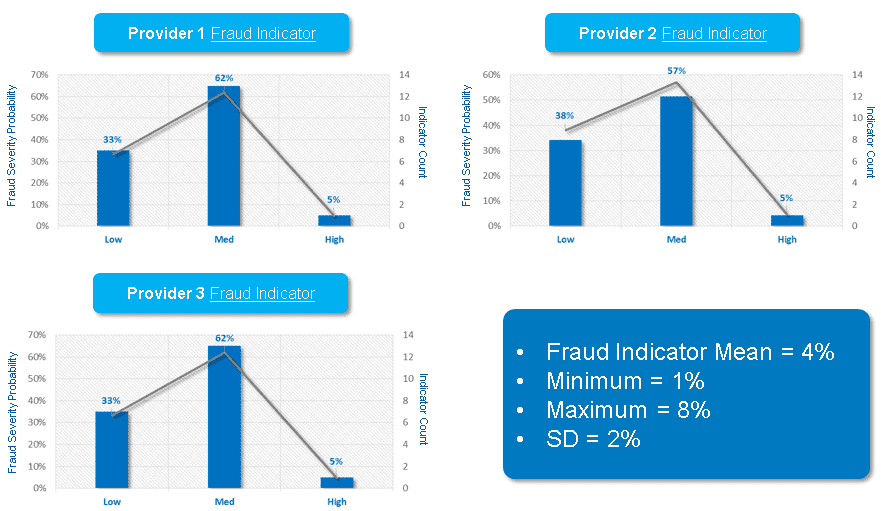
Note: Above frequency graphs are based on the Monte Carlo Simulation that gives a probabilistic perspective for the Fraud Indicator conversations that might lead to an actual fraud incident. The above outputs are based on the 1000 simulations where each simulation is equally likely to happen.
By looking at the above results one can easily isolate those providers or scenarios that can results in a potential fraud incident before it happens and mitigate a potential risk to the consumer, the brand and the overall reputation of any healthcare service provider.