
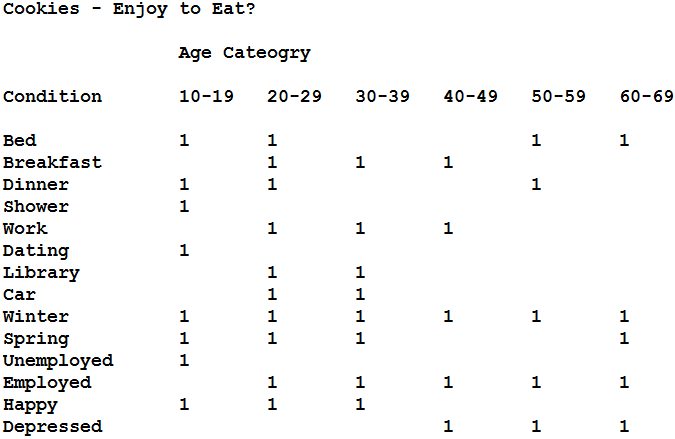
It’s possible I haven’t shared my story of being asked whether people can leap over lampposts. The question was posed by a university professor although I don’t recall the exact context. In response, I asked if the people are on this planet. He hissed at me, “Of course they are on this planet!” Some planets have low gravitational fields that make it possible for humans to leap great heights. At the time it didn’t seem like an oratorical question; and so I made an effort to answer it. The professor’s interpretation of truth allowed for little deviation: people lack the ability to jump over lampposts – end of story. But life is often not nearly so simple. Consider a complex response somebody might give to a simple question: “Do you like eating cookies?” Well, even ignoring the type of cookie and whether or not the individual is full, the question of whether or not a person likes to eat cookies probably depends on many things. Consider a possible breakdown of of the situation below. Myself, if I were in a trench avoiding gunfire from an opposing army, eating cookies would likely lull me into a false sense of security. So I would not eat cookies during trench warfare. If I were in a park watching ducklings pass by on their way to creek alongside a stretch of willow trees, I might eat maybe half a dozen cookies.
Sometimes the truth can mean many things. The tendency to diminish the truth such that it fits a narrow perspective is dangerous. It seems to me, this is precisely what science tends to do; and science can be dangerous for this reason. However, the purpose of this blog isn’t to argue about science. I want to discuss the problem of mixed messages or signals. An analysis – depending on its criteria or on how the sampling is done – can lead to different interpretations of reality. I will be discussing these differences using my own methodology; although I am certain that almost everyone has had to face similar blurriness regardless of methodology.
Simulation
The purpose of this simulation is first to establish the effectiveness of my methodology and second to demonstrate the impacts of sampling changes. The resulting impacts create a number of interpretive problems. Those interested in the code that generated the simulation can obtain it here: Simulation.java. (The code is not compilable because it is missing the package faithful.standard.*) Readers interested in obtaining the data generated by the simulation may download it: simulation.zip.
In the simulation, there are 100 menu items that I have never eaten before. The code below darkened in black shows that, of these 100 menu items, #33 and #66 are exceptionally nutritious. The nutritional value of the other items is random. If I tried simply eating 1 item each day for 100 days as an experiment, there wouldn’t be enough caloric intake for me to survive. Consequently, I am allowed to eat 10 items each day. The simulation runs for 365 days. Keeping in mind that randomness causes the goodness of the items to vary, including #33 and #66, is it possible to discover the superiority of #33 and #66 over the other menu items? I can deal with this question using the Crosswave Differential Algorithm, which I developed myself a few years ago.
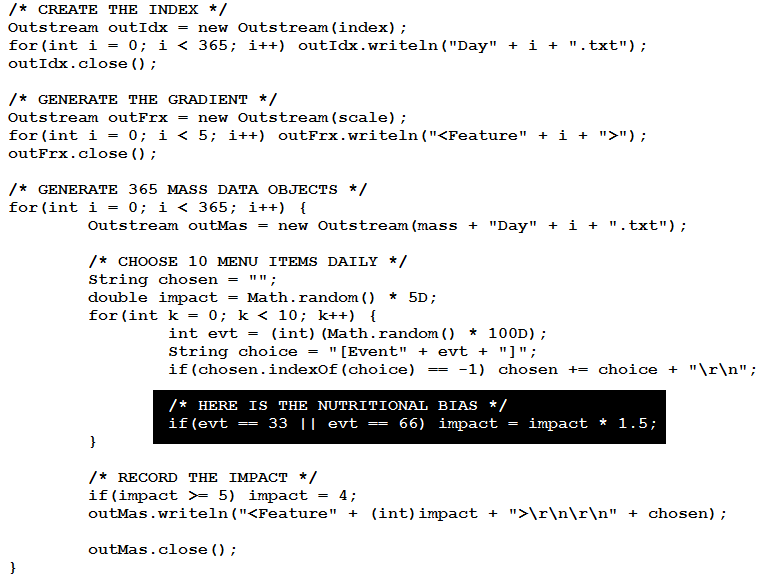
Note how the nutritional metric is expressed using “(int)impact” in the darkened code. All impacts must be less than 5. In other words, the nutritional impact is limited to exactly 0, 1, 2, 3, and 4. These symbols are numerical only symbolically. They could be replaced by a 5-item scale such as “terrible, poor, medium, good, and excellent.” Those that follow my blogs should be familiar with my algorithm: its purpose is to rank events (e.g. menu items) based on their relevance to particular metrics (e.g. nutrition). After running the algorithm, I obtained the distribution of events shown on the chart below: it presents the best nutritional impact on the left to worst on the right.
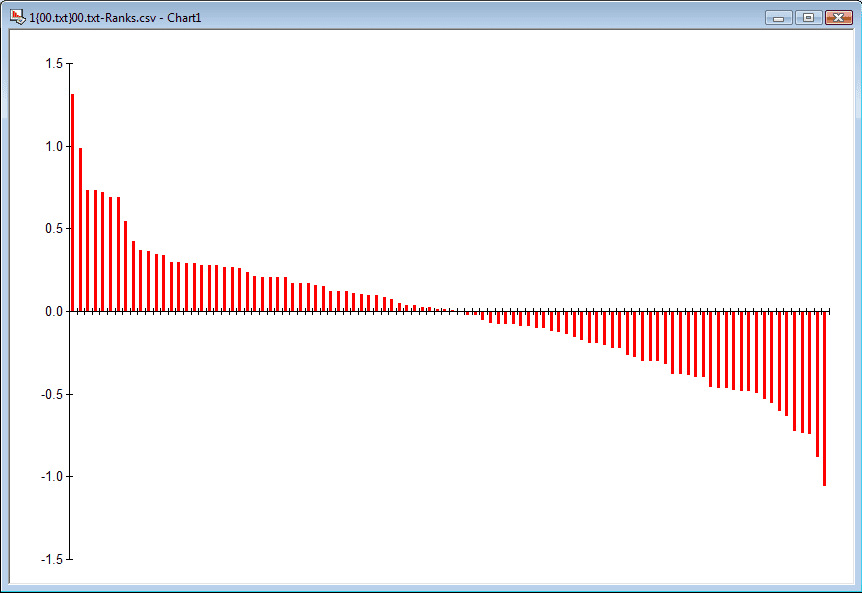
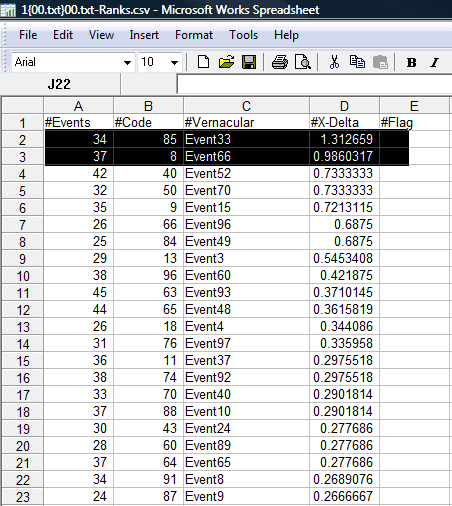
The underlying table for the chart is shown below. The table indicates that Event33 and Event66 are at the top of the list – meaning that they have the highest crosswave differential values (under the column “x-delta”). Apart from finding #33 and #66 most relevant for nutrition, the chart also provides a distribution of all the other menu items. The algorithm has therefore successfully identified the most nutritional items.
Here Is the Blurriness
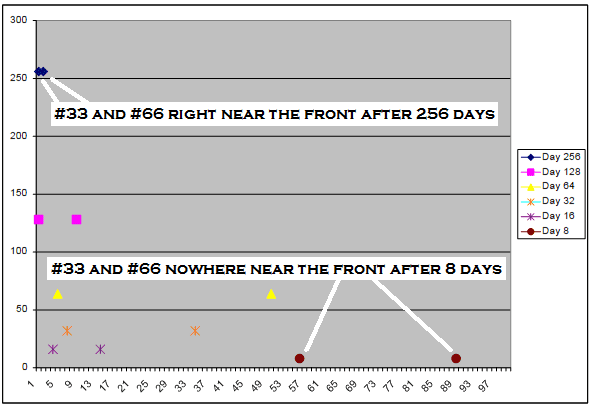
Despite my success identifying the most nutritious items using the algorithm, there are some conceptual problems that I consider important. I introduce a chart containing the locations of #33 and #66 for the following samples: 8 days, 16 days, 32 days, 64 days, 128 days, and 256 days. Recall that the menu items are distributed over a horizontal spectrum. The positions for #33 and #66 at 8 days are at the bottom of the chart – nowhere near the front of the spectrum. The positions at 256 days appear near the top of the chart – at the front of the spectrum. I think many data scientists would say that it makes sense for signals to become stronger as more sample days are added to the analysis.
Common wisdom would drive an analyst to discount the value of signals that use relatively few days in favour of signals based on a many days. I find that some technically-inclined investment advisors have a similar inclination: they put more emphasis on the heavier average rather than the day-to-day or week-to-week fluctuations. Yet it isn’t a law that the heavier average must win. For instance, a company destined to go under will never recover to its historic average. Conversely, a penny stock with little or no history might emerge as the next market favourite. When are signals correct enough to be followed? I don’t believe that the truth should be examined in isolation – ignoring the interconnectedness of elements. Rather, the apparent truth is part of an ecology – perhaps the most superficial part.
The inclusion of sample days seems like a purely methodological consideration. But the inclusion of days is only what appears on the surface. In reality, interactive diversity is being added. I am suggesting that, in the absence of laboratory conditions, stable and systemic equillibria can help bring out the truth in uncontrolled settings. The natural balance creates the control. The bigger problem for me is to determine when a system is actually in balance. The assumption that time brings about balance is correct until it is incorrect; it is superfluous. If I know that the 256 day sample is in balance and the 8 day sample is not, I can reasonably wait for balance to occur. “Balance” from the standpoint of the Crosswave Differential Algorithm is where the differential reflects reality – i.e. is truthful – as a result of equillibria. If one suddenly develops food poisoning or a severe illness, a significant amount of the guidance available from past data – collected during a period of relative health – might become superfluous. The “historical” truth might never be reached – for it might now be lying.
One of the wonders of old age is learning to accept gradual and permanent changes to the body and its abilities. Adolescence becomes a mirage in the totality of things – a fictional narrative where one temporarily feels indestructible. I anticipate no restoration. However, It is difficult to know what experiences and changes are temporary. This profound blurriness has led me to the belief that truth is 1) a moving target and 2) an adaptive organism. It is not a sterile conclusion to a hypothesis. One does not find truth but rather is swallowed by it – like being taken into a forest. Fractals of time and shades of existence scurry in and out of it. The truth is not a pristine singularity. It lives not in the light of the sun but rather the surrounding darkness. If one is seeking the truth, it is not enough to follow a path of reasoning to its logical conclusion. It is necessary to be engrossed in the details of the journey. On a more algorithmic level, I would rely on the spectral attenuation monitor (the preceding chart) to better understand what is known; this of course leaves out what is unknown. But as I said, the objective shouldn’t be to determine the “known” but rather to search for truth in the much greater “unknown.” Suffice it to say, I need more computing power because there is a great deal that I don’t know. “Do I like cookies? I think so – yes, no, and maybe!” “You mean you don’t know?” “Oh, I do know. I know what I know hardly means anything.”