
The need to stop malware
Today’s biggest cybersecurity challenge is malware. Malware are malicious programs designed to compromise systems and exfiltrate sensitive information from organizations.
Traditional defenses like firewalls, intrusion detection systems, content filtering proxies and antivirus software have proven to perform successfully in what they were designed to do; however, they were never meant to stop threats that are highly stealthy and polymorphic, like malware is nowadays.
Several new strategies have been developed in recent years to target malware detection. The most popular among them is sandboxing, consisting of running suspicious content and binaries in a simulation environment in order to analiyze its behavior. The main disadvantage of these systems is that malware can detect that it’s running under such a simulation environment and hide its malicious features, hence looking to be legitimate.
As a result, there is a need to come up with new detection techniques that are simple, effective, and not dependant on patterns or signatures that attackers can modify overtime to render security systems useless.
Beyong signatures and behavior-based detection
Most security systems’ strategy to detect malware is geared towards searching for patterns that uniquely identify a certain malware binary or family (signature-based) or on spotting malicious behavior exhibited by the program (behavior-based).
However, one common feature of all malware samples is that, once they are living in the target system, they will eventually connect to an external host. This server (called C&C, or Command & Control) will tell them what to do, and will store exfiltrated information.
Malware uses different techniques to find out what server it must connect to (for example, DGA, or Domain Generation Algorithm), but at the end of the day, it will open a connection to a certain domain, that will be tracked by either the firewall, the content filtering proxy, or both.
Having that in mind, the focus of this article is to define, implement an test an strategy geared towards uncovering those malicious connections, by identifying what Internet domains of all external communications seen in a network are related to malware.
Data collection and feature selection
It turns out that the problem is all about distinguising legitimate and malicious domains. The first step, then, is to gather a number of both types of domains to build our dataset.
Malware-related domains were obtained from https://www.malwaredomainlist.com/mdl.php. Figure 1 shows a screenshot of this website:
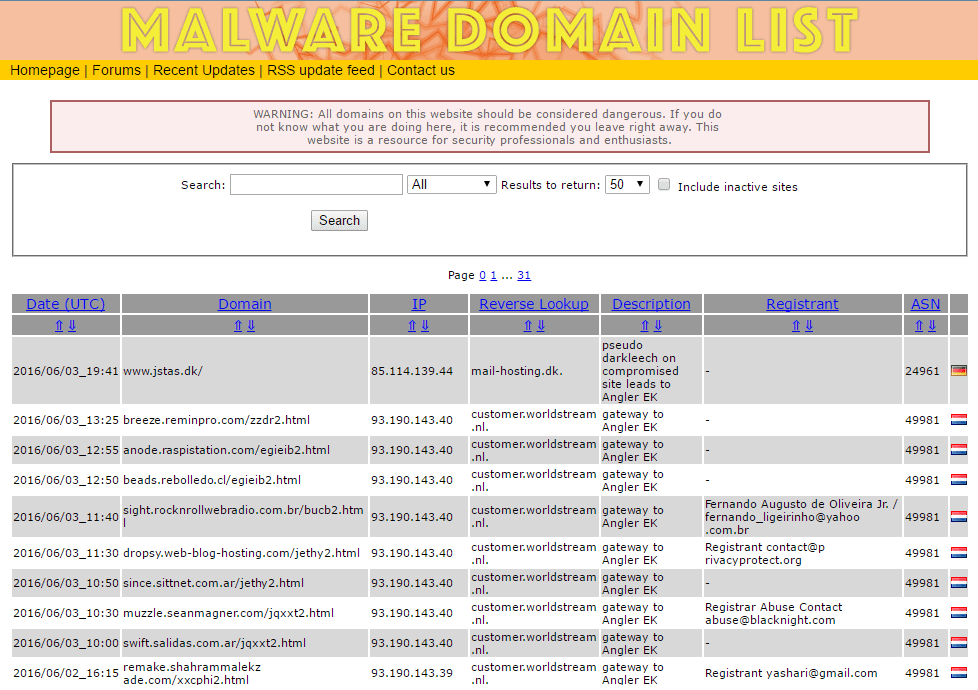
Figure 1. Main page at www.malwaredomainlist.com.
Legitimate domains were obtained from an Internet browser’s history.
Next step is to chose the right features– that is, the ones for which malicious domains might exhibit different values than legitimate ones.
The following features were selected:
- Alexa rank, which measures the domain’s popularity, as reported by www.alexa.com.
- Number of results returned by a search in Google
- Country where the domain is hosted
- Length of default webpage
The following table contains the values for both types of domains.
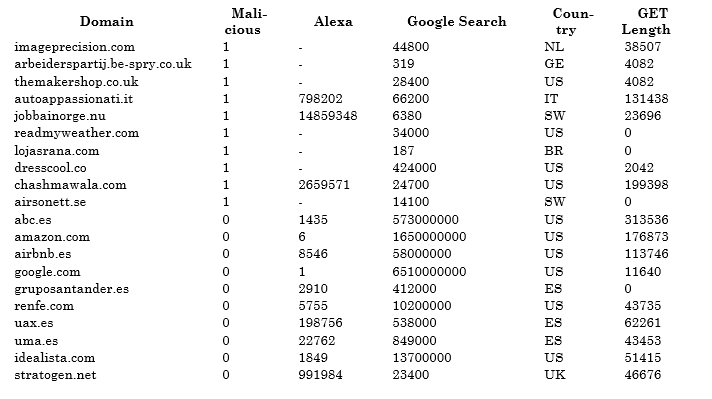
Table 1. Dataset with legitimate and malicious domains.
Scatter plots into action
Dimensionality reduction is a common techique to visualize observations in a dataset, by combining all features into two, that can then be used to draw the observation in an scatter plot.
One popular algorithm that implements this technique is PCA (Principal Components Analysis), which is available in R through the prcomp() function.
The algorithm was applied to observations of sthe dataset, and ggplot2’s geom_point() function was used to draw the results in a 2D chart. Figure 2 shows this chart:
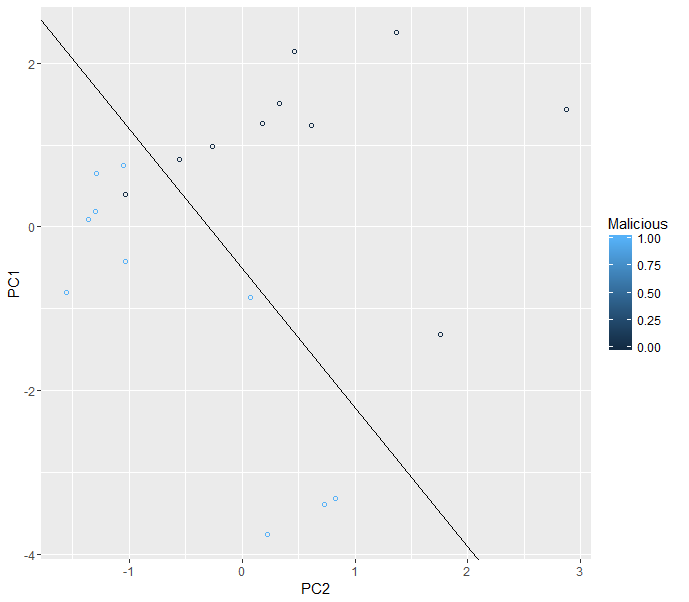
Figure 2. Scatter plot showing legitimate and malicious domains.
It turns out that there are two regions in the chart. Black circles are legitimate domains, while blue circles are malicious domains. ggplot2’s geo_abline() function was used to draw the line that divides the chart into those two regions.
Validating the model with additional domains
A number of additional malicious domains were gathered for testing purposes. These domains’ features where combined into two values by applying the PCA algorithm, and those values were drawn in the previous chart as filled blue circles.
Figure 3 shows the results.
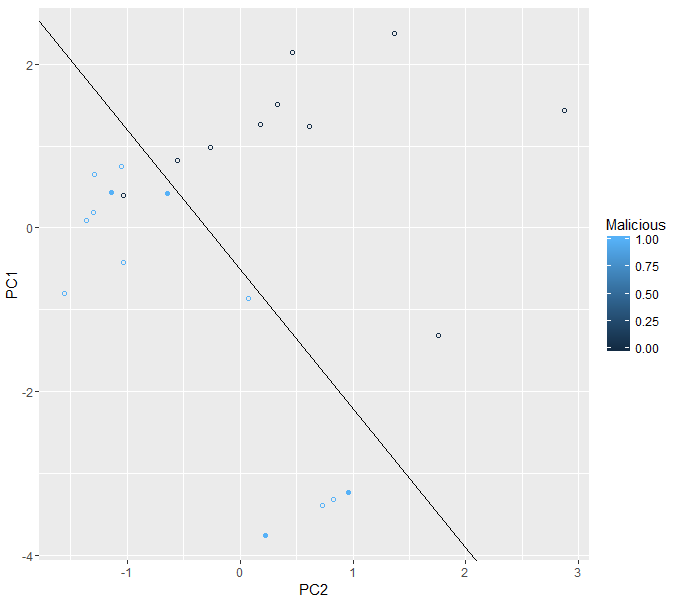
Figure 3. Scatter plot with additional malicious domains.
From the results, it looks like the features selection exercise worked reasonably well. The four new malicious domains are displayed in the same region as the previous ones, which effectively means that the algorithm was able to accurately flag these domains as malicious.
In other words, the algorithm could be used to spot future malware-related connections by running it against all external domains contacted from systems in an organization’s network, and checking which of them fall into the blue region in the chart.
Lessons learned
The previous exercise must be considered as a proof-of-concept that requires further development before it can be designated as a proven solution to detect malicious domains and malware-related connections. The main and obvious limitation is the number of records, which is quite low for any form of inference.
However, the concept shows that machine learning techniques are a reasonable alternative to current security systems in order to defeat malware. Moreover, the following arguments make an analytics-based solution more powerful and convenient:
1) Simplicity: instead of analyzing complex elements as binary structure, content, behavior under a simulation environment, or traces left in an infected system, our solution target the only feature that remains common to all malware samples: connections made to an external server.
2) Resiliency: malware evolves to defeat security systems, by hiding or dynamically changing patterns or behavior that these systems monitor. Once it achieves that, security systems become less and less effective, as they can’t easily evolve to also look for other malware fingerprints that remain visible.
However, our solution can easily evolve to evaluate new features that are unique to malicious domains. The following are just a few examples:
- Number of search results in other search engines
- Number of bytes before first “<body>” HTML tag (or “<script>”, or “<img”) is found in index.html.
- Number of HTML tags of a certain type in index.html.
- Position in other ranks
- Domain’s registrant details (name, location, e-mail, phone, etc.).
- Any field available in domain-related databases as www.domaintools.com
Moreover, our solution relies on several features that can’t be easily modified by attackers. It’s not trivial to make an Internet domain more popular, or to increase how many search results are returned by a search engine.
Where we are heading to
The cybersecurity world is exciting. However, it becomes even more exciting when data analytics jumps in. Security professionals are yet to discover how machine learning, visualizations, big data and data science can help them to approach their key challenges.
No one said that data scientists would make cyber criminals’ life easier.