
This article was written by Sunil Ray. Sunil is a Business Analytics and Intelligence professional with deep experience.
Introduction – the difference in mindset
I started my career as a MIS professional and then made my way into Business Intelligence (BI) followed by Business Analytics, Statistical modeling and more recently machine learning. Each of these transition has required me to do a change in mind set on how to look at the data.
But, one instance sticks out in all these transitions. This was when I was working as a BI professional creating management dashboards and reports. Due to some internal structural changes in the Organization I was working with, our team had to start reporting to a team of Business Analysts (BA). At that time, I had very little appreciation of what is Business analytics and how is it different from BI.
So, as part of my daily responsibilities, I prepared my management dashboard in the morning and wrote a commentary on it. I compared the sales of first week of the current month to sales of previous month and same month last year to show an improvement in business. It looked something like this:
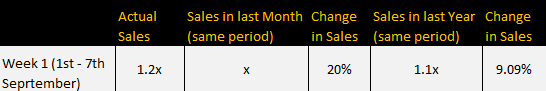
In my commentary, I ended up writing that sales are better than last year and last month and applauded some of the new initiatives the Sales team had taken recently. I was thinking this was good work to show to my new manager. Little did I know, what was in store!
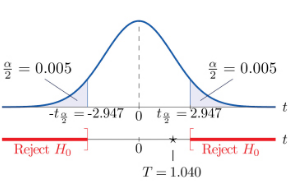
When I showed the report to my new manager applauding the sales team, he asked why do I think this uplift is just not random variation in data? I had very little Statistics background at this time and I could not appreciate his stand. I thought we were talking 2 different language. My previous manager would have jumped over this report and would have dropped a note to Senior Management himself! And here was my new manager asking me to hold my commentary.
In today’s article, I will explain hypothesis testing and reading statistical significance to differentiate signal from the noise in data – exactly what my new manager wanted me to do!
What you will find in this article:
A case study
Basics of Statistics
- Z-Value/ Table/ p value
- Central Limit Theorem
What is Significance Level?
What are the steps to perform Hypothesis Testing?
- Set up Hypothesis (NULL and Alternate)
- Set the Criteria for decision
- Compute the random chance of probability
- Make Decision
Directional/ Non Directional Hypothesis Testing
To check out all this information, click here. For an alternate, simple, non-mathematical approach to statistical hypothesis testing, click here.
Top DSC Resources
- Article: What is Data Science? 24 Fundamental Articles Answering This Question
- Article: Hitchhiker’s Guide to Data Science, Machine Learning, R, Python
- Tutorial: Data Science Cheat Sheet
- Tutorial: How to Become a Data Scientist – On Your Own
- Categories: Data Science – Machine Learning – AI – IoT – Deep Learning
- Tools: Hadoop – DataViZ – Python – R – SQL – Excel
- Techniques: Clustering – Regression – SVM – Neural Nets – Ensembles – Decision Trees
- Links: Cheat Sheets – Books – Events – Webinars – Tutorials – Training – News – Jobs
- Links: Announcements – Salary Surveys – Data Sets – Certification – RSS Feeds – About Us
- Newsletter: Sign-up – Past Editions – Members-Only Section – Content Search – For Bloggers
- DSC on: Ning – Twitter – LinkedIn – Facebook – GooglePlus
Follow us on Twitter: @DataScienceCtrl | @AnalyticBridge