
I’m missing my Thursday evening Big Data MBA classes at the University of San Francisco School of Management (though I expect my students are glad that ordeal is over). One of my biggest learnings from this semester was around how to properly construct an actionable and measurable business hypothesis. One of the common mistakes is starting with an overly-simplified business objective such as:
- Improve customer subscription renewals by X%
- Reduce inventory costs by X%
- Improve customer Likelihood to Recommend by X%
- Improve on-time delivery by X%
- Reduce unplanned downtime by X%
The problem with these business objectives is that they don’t fully capture the complexity of the real business world – they are one-dimensional; they only solve for a single variable. For example:
- I could improve customer subscription renewals by X% by simply not charging for renewals (probably not good for the long-term profitability of the business). Or…
- I could reduce inventory costs by X% by getting rid of all inventory (will likely eventually lead sales, revenue and customer satisfaction problems down the road). Or…
- I could improve on-time delivery by X% by buying more delivery trucks and hiring more drivers (again, hard on profitability).
One can quickly see that those solutions, while technically possible, are not realistic. Optimizing a single objective, or a single point, is actually quite easy because there are no conflicting objectives. The real business challenge, and the source of much innovation, is trying to optimize a decision across multiple variables. Let’s explore this further.
Economics of Optimizing Multiple Conflicting Objectives
Let’s say that you want to reduce unplanned operational downtime. You could be an airline or airport or hospital or entertainment venue or train or fleet manager or utility operator or an oil platform or hotel or any number of operations where unplanned downtime has significant negative impacts on profitability, operations and customer satisfaction.
If my only business objective was to reduce unplanned operational downtime along that single dimension, I could easily address that objective by just increasing spend on parts, inventory and labor in order to fix E-V-E-R-Y potential problem that you think might occur such as replacing any parts that show wear-and-tear, lubricating the parts constantly and performing parts inspections, having redundant inventory on every part and repair consumable, adding sensors to every component to capture every reading and vibration, etc. Again, not realistic in the long-term if you are trying to balance profits and operational costs.
So let’s broaden the “Unplanned Operational Downtime” example to optimize business and operational performance across two conflicting dimensions: Increasing uptime while reducing maintenance costs. Now it’s getting interesting, and here is where economics can help us.
We can create an economics value curve that helps us determine the point of optimization between 2 variables like Uptime Percentage versus Cost of Maintenance. The value curve in Figure 1 shows the relationship between Uptime Percentage and Cost of Maintenance.
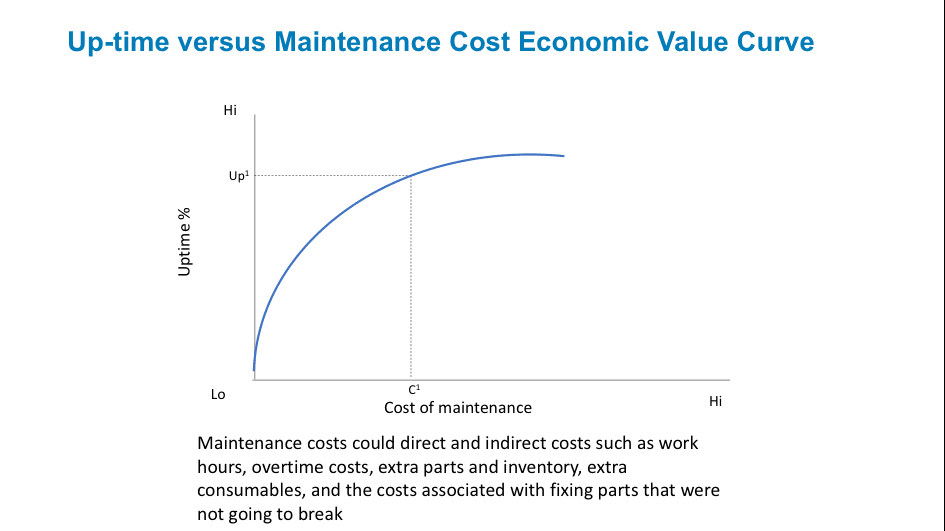
Figure 1: Economic Value Curve
The only way to improve operational uptime given the economic value curve is to spend more money on maintenance. That is, in order to move uptime from Up1 to Up2 we need to increase maintenance investment from C1 to C2 as in Figure 2.
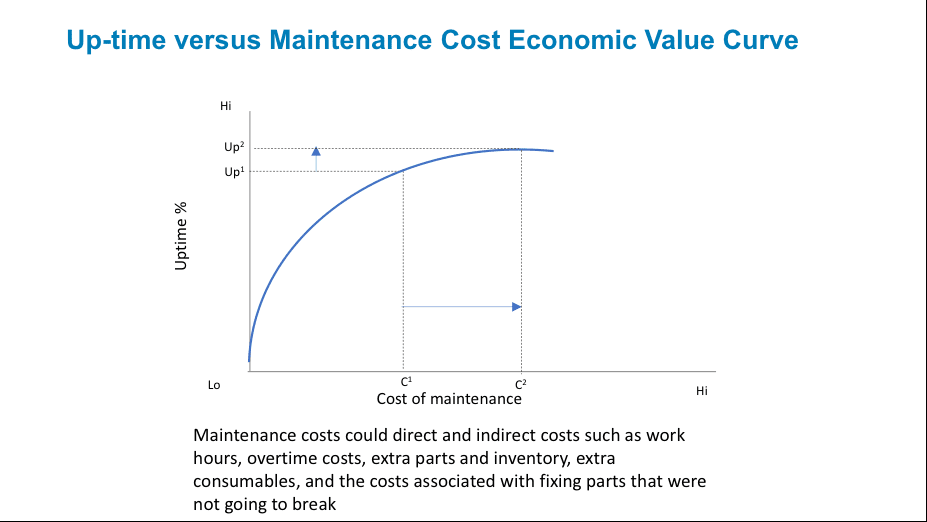
Figure 2: Traversing the Economic Value Curve
The only way that the organization can improve up-time given the current economic value curve is to spend more money and time on maintenance. Unfortunately, increasing maintenance spend from C1 to C2can increase uptime from Up1to Up2, though the increase is not likely to be linear as uptime reaches its theoretical limit.
Unfortunately, economics throws a little wrinkle into the relationships on the economic value curve, and that’s the “Diminishing Returns” dilemma. In economics, Diminishing Returns is the decrease in the marginal (incremental) output of a production process as the amount of a single factor of production is incrementally increased, while the amounts of all other factors of production stay constant. And we can see in Figure 2 how it takes a much more significant investment in maintenance costs (Δ C2 – C1) to achieve a much smaller incremental improvement in Uptime Percentage (Δ Up2 – Up1).
Nerd Alert!!
For those who have not totally forgotten their college mathematics, you’ll notice that this is the formula for calculating the slope of a line where m = (y2 – y1) / (x2 – x1).
Since the slope is a constant rate of change for a linear function, when the slope of the line drops below 1, then you are experiencing Diminishing Returns on your investments.
Digital Transformation Is About Changing the Economic Value Curve
The way to change the game and beat the law of Diminishing Returns is to re-engineer the sources of value creation to create a new economics value curve. That is, for the same C2 spend, how do I get an Uptime Percentage increase from Up2 to Up3 (see Figure 3).
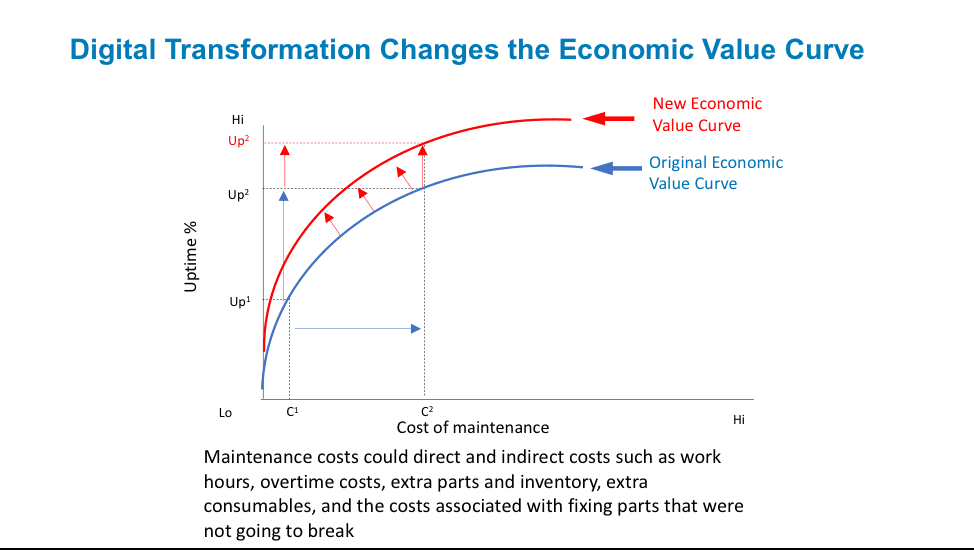
Figure 3: Transforming The Economics Value Curve with Data and Analytics
How do we digital transform our economics value curve? How do we use data, analytics and design to change the economic value curve? Doing the same old things, even more quickly and more cheaply with robotics, does not transform the economics value curve. What does transform the economics value curve is to re-engineer the process using data and analytics – using “intelligence.”
For example, Amazon has digitally transformed their warehousing operations using non-conventional, analytics-inspired business and operational changes. One example is how Amazon’s warehouses randomly stock shelves on purpose. Instead of painstakingly stocking all the toilet paper grouped by brand in one area and all the toothpaste grouped by brand in another area and all the dry cereals grouped by brand in another area, Amazon actually randomly places the inventory in whatever space is most convenient (where convenience is determined by a stocking algorithm that looks at open space, distance to that space, size of the items to be stocked, etc.
From the article “Amazon’s Prime Now Warehouses Randomly Stock Shelves on Purpose”, we learn:
“Every item is scanned and its location logged on computer. Amazon then uses software to scan orders, look up where all the items are stored on the shelves, and plot the most efficient and fastest route for a worker to take to collect them all. Ultimately, the random placement doesn’t matter as long as the scanning happens. It also speeds up the restocking of the shelves as workers don’t need to worry where products are placed.”
Note: this is how disk drives have stored information for ages and works perfectly as long as you have a catalog of where everything is stored (e.g., hashing, pointers, indices).
Optimizing Across N-Dimensions Drives Innovation
Now back to our operational downtime problem. What if 60% of your downtime problems are caused by customers (dropping stuff, getting sick, struggling to get in and out of cabins, etc.) and not mechanical problems? Could you just ban any customer who might cause any of these sorts of problems (disallow cell phones, disallow loose clothing, disallow any above a certain height or certain weight or certain BMI)?
In fact, the more dimensions against which you have to optimize, the more creative and innovative your data and analytic-driven solutions are going to have to be. For example, how about:
- Increasing operational uptime while reducing maintenance costs while improving customer satisfaction, or better yet…
- Increasing operational uptime while reducing maintenance costs while improving customer satisfaction while reducing carbon footprint and emissions, or better yet…
- Increasing operational uptime while reducing maintenance costs while improving customer satisfaction while reducing carbon footprint and emissions while increasing employee job satisfaction.
I think that you get the picture, that the more dimensions against which you have to optimize, the more opportunities (requirements?) there are for thinking outside the box, for dropping conventional thinking (and limitations) to find ways that can optimize all n-dimensions.
Changing the Economic Value Curve
New technologies (see Figure 4) are emerging to help organizations digitally transform their economic value curves. However, each of these emerging technologies – Robots, Internet of Things, Drones, Virtual Reality, Augmented Reality – are highly dependent upon analytics such as Machine Learning, Deep Learning and Artificial Intelligence (AI) that make these emerging technologies smarter than just replicating existing, irrelevant operational process (that’s just Paving the Cow Path, which a good old Iowa boy like me totally understands).
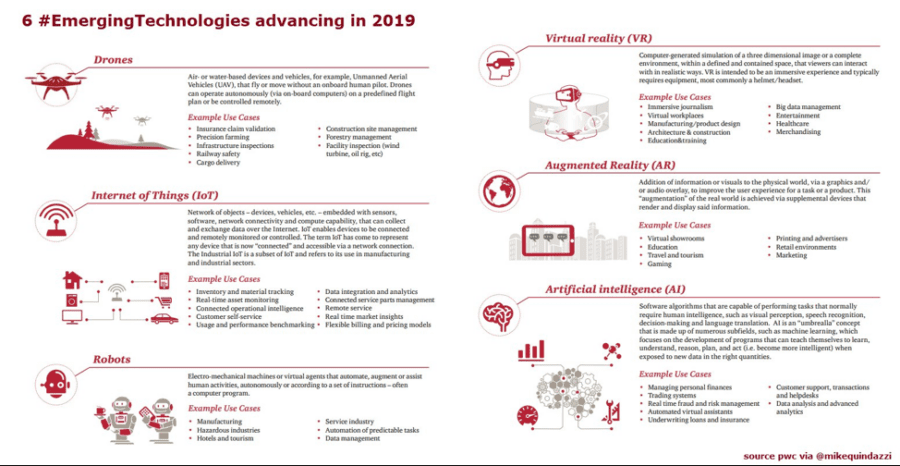
Figure 4: Source: PWC “The Journey to Digital Trust“
Organizations have an opportunity to exploit these emerging technologies to create intelligent products and smart spaces that can self-monitor, self-diagnose and self-heal. As I covered in the blog “3 Stages of Creating Smart”, the 3 stages necessary to creating a continuously learning, “Smart” entity include:
- Self-monitoring: An environment that continuously monitors operations for any unusual behaviors or outcomes (Analogy Detection, Performance Degradation, Security Violations). Leverages Internet of Things sensor data to closely monitor key operational processes.
- Self-diagnosis: Leverages Diagnostic Analytics to identify the variables and metrics that might be impacting performance, and Predictive Analytics to predict what is likely to happen and when it is likely to happen. Leverages Internet of Things intelligent to predict operational problems and the severity / urgency of those problems.
- Self-fix or Self-heal: Applies Prescriptive Analytics to create actionable insights, and Preventative Analytics to recommend user or operator corrective actions to prevent problems such as unplanned operational downtime. Leverages robots, drones, augmented reality and virtual reality to support and accelerate the ability to self-fix (with minimal human intervention required).
Using the Economics Value Curve to Drive Innovation
So what is innovation?
Innovation is the ability and willingness to constantly challenge conventional business and operational processes and models (willingness and ability to unlearn conventional thinking, heuristics and rules of thumbs) in order to re-engineer the organization’s value creation and capture processes using strategic, actionable and material (S.A.M.) customer, product and operational insights.
Economics, Data Science, Design Thinking…wow, now we’re starting to have some real fun!!