

I was hanging around the LinkedIn water cooler the other day, just minding my own business, when I came across this very interesting graphic (Figure 1) from Brent Dykes titled “Conquer the Last Mile in the Analytics Marathon.”
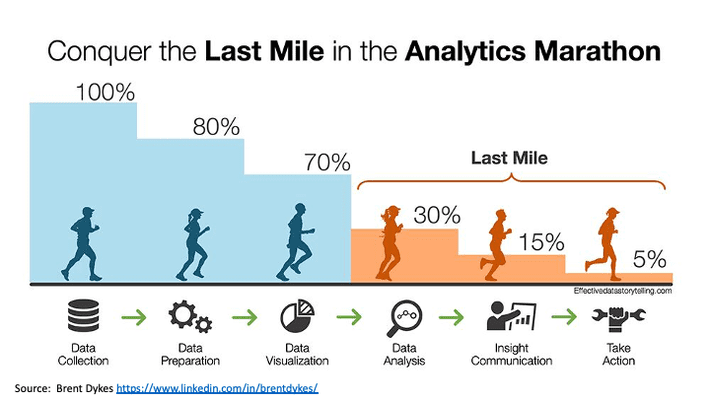
Figure 1: “Conquer the Last Mile in the Analytics Marathon” by Brent Dykes
Brent said Figure 1 represents his estimate of projects that successfully complete each stage of the “Analytics Marathon”. It is very evident that there is an inflection point between the part of the analytics marathon that is the responsibility of data engineering, feature engineering, and data science (in the blue frame), and the part of the journey which is the responsibility of the UEX designer, business analyst and the business stakeholders (in the orange frame). And that’s where the challenge of the last mile rears its ugly head.
Yes, data science teams can engineer data, extract features, and build AI / ML models that deliver analytic insights. But data science teams must “swing through the pitch” in providing contextual guidance to data consumers to “take action” based upon the analytic insights.
Using Design Thinking to Win the Last Mile – Providing Contextual Guidance
The one thing that I realized from Brent’s graphic was that my “Thinking Like a Data Scientist” methodology was missing that “last mile” step in providing that contextual guidance in how the customer, product, and operational insights could be presented in a manner to help the data consumers make more informed decisions.
The “Thinking Like a Data Scientist” (TLADS) methodology seeks to:
- Establish a thorough understanding of the business initiative against which the organization seeks to apply data and analytics to drive business outcomes (Step 1).
- Drive ideation across a diverse set of stakeholders to identify the KPIs they will use to measure progress and success of the business initiative (Step 2).
- Identify the entities (human or device) against which we will apply data and analytics (Step 3).
- Identify, validate, value, and prioritize the Use Cases (decisions plus KPIs) that support the targeted business initiative (Step 4)
- Drive business and data science collaboration in the Feature Engineering to identify variables and metrics that are better predictors of performance (Steps 5 and 6).
- Finally, identify the prescriptive recommendations that guide the prioritized decisions and create analytic scores that power those recommendations (Steps 7 and 8).
But after reviewing Brent’s graphic, I realized that I am missing Step 9: “Create Mockups” that provide the contextual guidance to put the prescriptive recommendations and analytic scores into action (Figure 2).
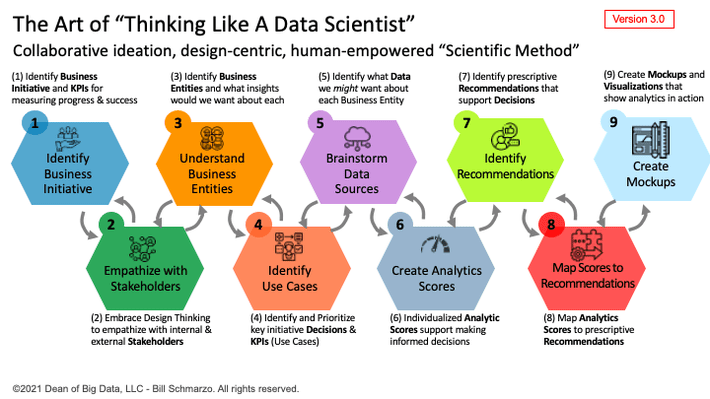
Figure 2: Extended “Thinking Like a Data Scientist” Methodology
In Step 9 of the TLADS methodology, we create mockups or rough prototypes of the user experience with respect to how we deliver the analytic insights that emulates the final product for idea generation, functionality validation, and execution confirmation.
And a mockup does not need to be fancy or developed in software to be effective. Mockups can be built using storyboards, post-it notes on flip charts, PowerPoint presentations, colored pencils on sketch paper, or any environment that facilitates the quick generation and modification of the mockup (Figure 3).
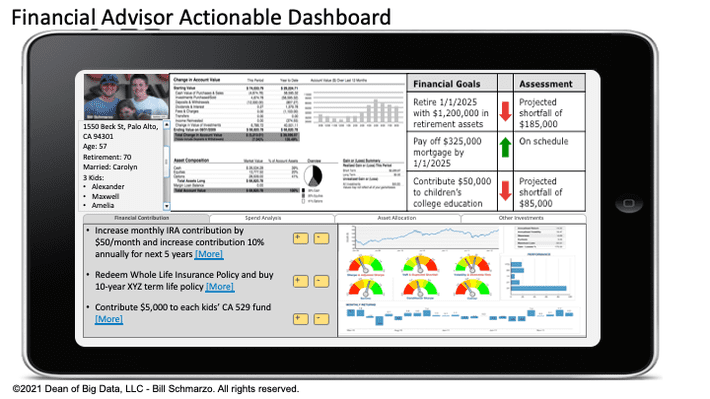
Figure 3: Financial Advisor Actionable Dashboard Mockup
But we can also use Design Thinking – and the “Thinking Like a Data Scientist” methodology – to ensure that we win the first mile of the Analytics Marathon.
Using Design Thinking to Win the First Mile
There are two design templates from the “Thinking Like a Data Scientist” methodology that ensure that we win the first mile of the analytics journey.
Design Template #1: Identify and Triage Targeted Business Initiative
A major analytics journey risk is the under-investment in understanding the business initiative to be addressed. Step 1 in the TLADS process enlists all stakeholders to understand what’s at stake with the targeted business initiative and how success will be measured (Figure 4).
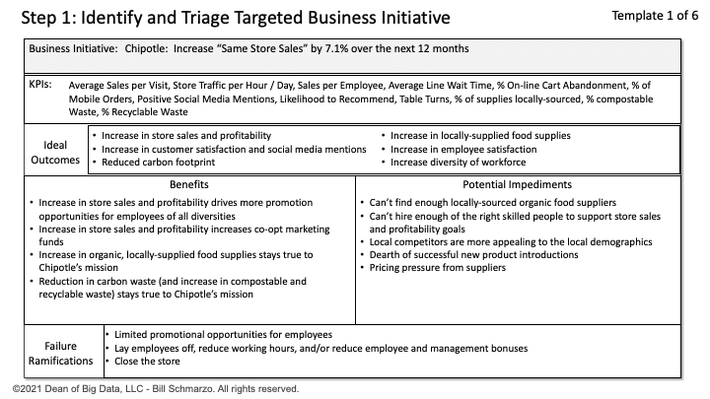
Figure 4: TLADS Template 1: Identify and Triage Targeted Business Initiative
Some of the key points captured in this design template include:
- Business Initiative. State the business initiative against which we want to apply data science and the potential value creation impact of solving this initiative.
- KPI’s. Brainstorm a diverse and comprehensive set of KPIs against which progress and success of the targeted business initiative will be measured.
- Ideal Outcomes. Identify the ideal outcomes from the success execution of this initiative; that is, what does good look like.
- State the business, operational, customer, employee, environmental and society/diversity benefits from the successful execution of this initiative.
- Potential Impediments. Capture the potential technology, organizational, cultural, data, analytics, industry, and regulatory impediments that could thwart successful execution.
- Failure Ramifications. Envision the business, operational, customer, employee, environmental and society ramifications if this initiative fails.
Design Template #2: Hypothesis Development Canvas
The Hypothesis Development Canvas in Figure 5 represents the culmination of the “Thinking Like a Data Scientist” methodology.
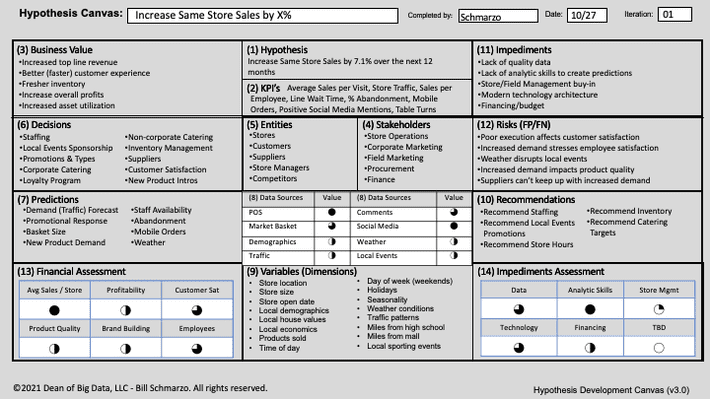
Figure 5: Hypothesis Development Canvas
The Hypothesis Development Canvas ensures that the data and analytics requirements are well-defined for the prioritized use case that comes out of the TLADS process, including:
- What is the hypothesis or use case that you are trying to improve, reduce or optimize?
- What are KPI’s against which hypothesis progress and success will be measured?
- What is the business value from the financial, operational and customer perspectives?
- Who are the business stakeholders who either impact or are impacted by the Hypothesis?
- What are entities – human or device/machine – around which to build the analytics?
- What are most important decisions that need to be made in support of hypothesis?
- What are the predictions required to support the business or operational decisions?
- What data sources might be necessary to support the predictions?
- What are the variables / metrics (features) that might be better predictors of performance?
- What business and operational recommendations are required to support the decisions?
- What are the potential technical, data and/or organizational impediments to success?
- What are costs or risks associated with the predictive model being wrong?
I am proud that Gartner, an industry-leading advisory service, highlighted the Hypothesis Development Canvas as a best practice in their research guide G00747729: “Five Fundamental Truths about Agile Methods” (Figure 6).
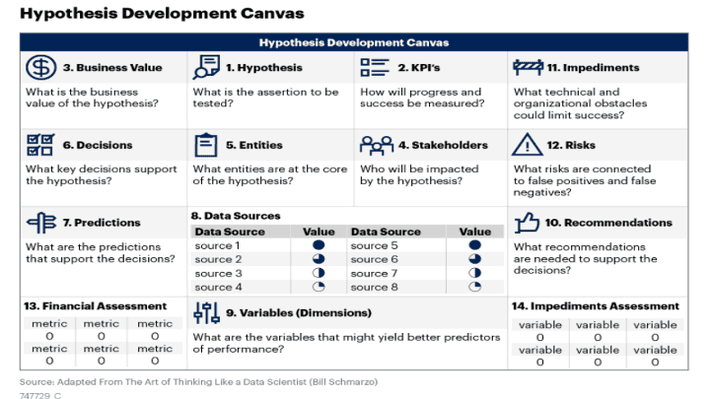
Figure 6: Gartner Version of the Hypothesis Development Canvas
Summary: Using Design Thinking to Win the First and Last Mile
Always learning. That’s mandatory in this ever-changing enviroment. And Brent’s graphic and observations about winning the last mile gave me the idea to expand my Thinking Like a Data Scientist methodology to formalize that “last mile” step of developing prototypes that emulates the final product for idea generation, functionality validation, and execution confirmation.
Design Thinking and data science are powerful disciplines when blended together. Design Thinking with data science not only ensures that organization’s win that first mile of the analytics journey by holistically defining the problem to be addressed, but is essential in winning that last mile by ensuring that the analytic insights are presented in a manner that is actionable and measurable for the ultimate data consumer.