
The data science ecosystem: R vs Python vs Substitutes
In this post, I show a network analysis of the R and Python ecosystems in terms of their competitors. The objective of the post is to –
- Identify the key tools/languages being commonly searched in the data science area related to R/Python
- Identify the sets of associated tools
To identify the typical substitutes/ competitors of a tool, I use the Google search autofill recommendations. Google search prompts identify the most frequently searched terms which occur after a given string and automatically provides a list of suggestions. Thus, this may be treated as a proxy for the common substitutes people search for against a particular tool.
Identifying the eco-system entities
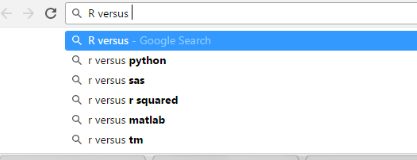
Figure 1 “R vs..” autofill suggestions
In Fig 1 when I start typing “R vs “ in the Google Search bar, Google provides a list of suggestions based on their ‘autocomplete’ feature. This predictions are based on factors like frequent searches by other people, the region, language, past web site visits, etc.
Those who are familiar with the data science wars, can immediately recognize that R vs Python was the most frequent search. Other common searches are substitute products for R e.g. sas/ matlab or commonly confused concepts e.g. r versus r squared. Since we are interested only in the products / tools /packages we ignore the suggestions which are not relevant (e.g. r squared). We add the rest of the terms to an edgelist table with source R and targets as ‘python’, ‘sas’ etc. Thus we have identified some of the common substitutes for R and also created an edge for them.
In the next step, we take each of the target nodes (‘python’, ‘sas’ etc.) identified through the above process and repeat the above steps. We add the results again to the edgelist table.
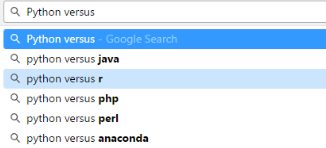
Figure 2 “Python vs..” autofill suggestions
Network analysis of the eco-system
Once the edgelist table is thus formed, we perform Network analysis of the eco-system to identify the most important entities.
We use ‘Force Atlas 2’ to identify components in the graph and visualize the eco-system. ForceAtlas2 is a force-directed layout used for network spatialization in Gephi. It is an attempt to integrate different techniques such as the Barnes Hut simulation, degree-dependent repulsive force, and local and global adaptive temperatures. In this algorithm – “Nodes repulse each other like charged particles, while edges attract their nodes, like springs. These forces create a movement that converges to a balanced state. This final configuration is expected to help the interpretation of the data.”
Thus, the layout positions the nodes which are compared together closer (since they have edges connecting them). Hence, groups of tools which are frequently compared occur closer in the network map than others. Thus, R, python, Matlab, SAS, are placed closed together, while tensorflow and php occur far apart. We then use ‘in-degree’ to size the nodes and use ‘Page rank’ of the nodes to size the labels. The edge colors indicate the cluster to which a tool is compared.
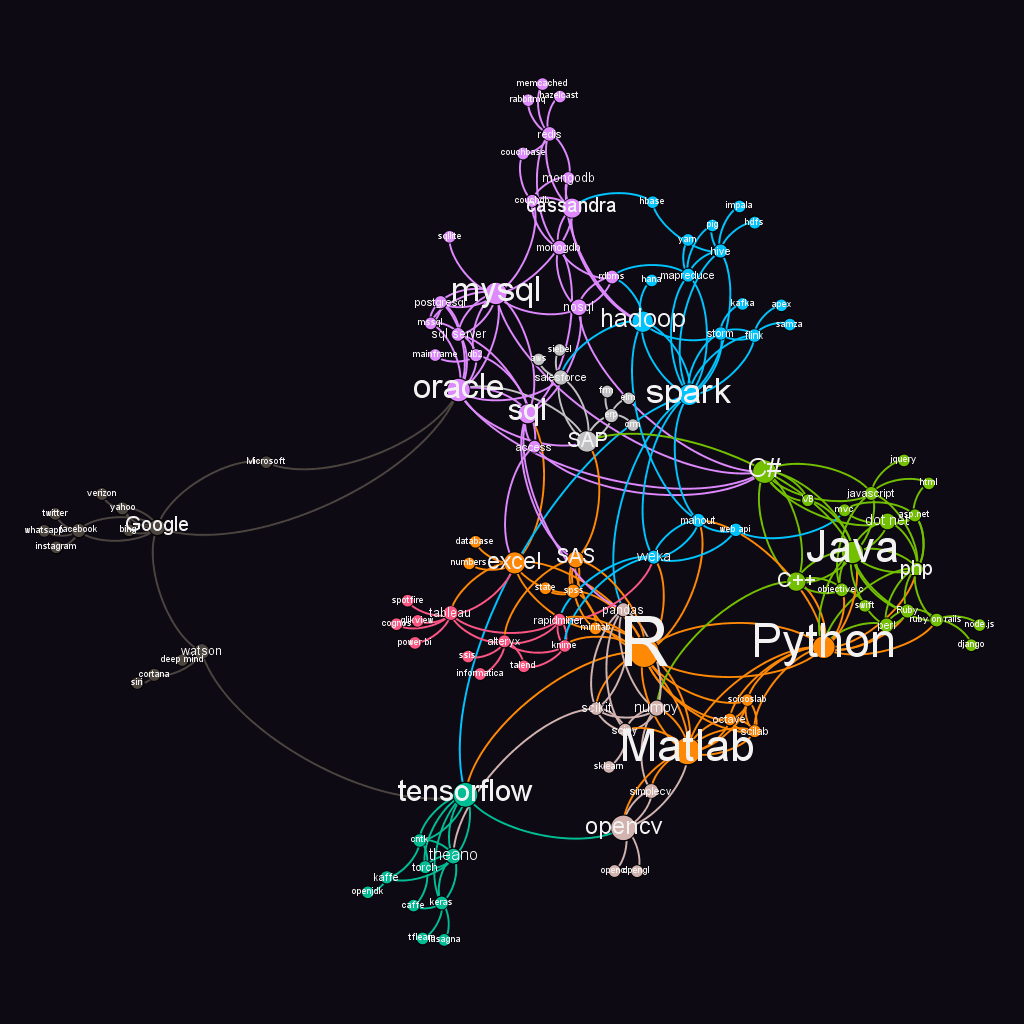
Figure 3 The R vs Python ecosystem
Analysis and Inferences
Based on the observations and analysis of the network we see that the eco-system consists of diverse sets of communities. Eight modularity classes emerged from the analysis using Blondel et. al., 2008, algorithm to identify communities as provided in Gephi. The modules are colored separately to allow easy visual identification. We can name them as follows –
I. Statistical data analysis tools and languages – R, Python, Matlab, SAS, SPSS, Minitab, Excel. etc
II. Enterprise tools for business intelligence – Weka, Rapidminer, Alteryx, Tableau etc.
III. Scripting and Traditional Programming languages – Java, php, C#, C++, etc.
IV. Database 1 – sql, Oracle, mysql, mongodb, Cassandra, etc.
V. Database 2 (Hadoop ecosystem) – Hadoop, Spark, Storm, Mapreduce, Hive, etc.
VI. Deep learning tools – Tensorflow, Theano, Cntk etc.
VII. Modules, libraries and packages for machine learning – pandas, scipy, opencv, tm, etc.
VIII. Machine learning platforms from Organizations – Google, IBM (Watson), Microsoft, Alphabet (Deepmind), etc.
Thus, the use of Python can be specifically more useful in teams where programming and scripting knowledge are already available, e.g. teams familiar with php, C#, Java, etc. It is also frequently compared to other statistical analysis languages like R, Matlab, and machine learning languages on haddop and similar platforms (e.g. mahout). Thus, the observation in the datacamp blog about Python being used by ‘programmers who want to delve into data analysis or apply statistical techniques, and by developers that turn to data science’ seems to still hold.
The use of R, on the other hand, is more commonly compared with the use of statistical data analysis tools like SAS, SPSS, Excel. It is also frequently compared to enterprise business intelligence tools and self-service platforms like Rapidminer, Tableau, Alteryx etc. Thus, similar to datacamps observation, R users are from academics, research, as well as from business analytics (the enterprise market). The frequent comparisons with Python, weka, etc. indicate the use of R by the machine learning programming community as well.
Similarly, those familiar with database technologies like SQL, oracle etc. may be more comfortable using big data techniques and machine learning languages available on platforms of Hadoop, spark etc. This is also the group which seems to be comparing their existing tools against enterprise machine learning toolkits and platforms on offer from firms like Google, IBM etc.
Those familiar with Matlab, frequently compare with scientific and machine learning package set from Python (numpy, scipy etc.) and also with R. They seem to be having an equally fair chance of using R and Python. This is the group, along with the R users, who are also comparing their tools against deep learning technologies like tensorflow, kafka etc.
Limitations
Google autocomplete depends on regions and language as well as previous search behavior. This may have affected the suggestions.
References
ForceAtlas2, a Continuous Graph Layout Algorithm for Handy Network …, Mathieu Jacomy , Tommaso Venturini, Sebastien Heymann, Mathieu Bastian, Published: June 10, 2014DOI: 10.1371/journal.pone.0098679
Vincent D Blondel, Jean-Loup Guillaume, Renaud Lambiotte, Etienne Lefebvre, Fast unfolding of communities in large networks, in Journal of Statistical Mechanics: Theory and Experiment 2008 (10), P1000
https://support.google.com/websearch/answer/106230?hl=en
http://www.datasciencecentral.com/profiles/blogs/data-science-wars-…
https://www.datacamp.com/community/tutorials/r-or-python-for-data-a…