
- Geospatial modeling may be the future of pandemic control.
- Recent studies analyzed local data and found hidden trends.
- Border control isnt enough to stop the spread of Covid-19.
- Where you live determines your risk for the disease.
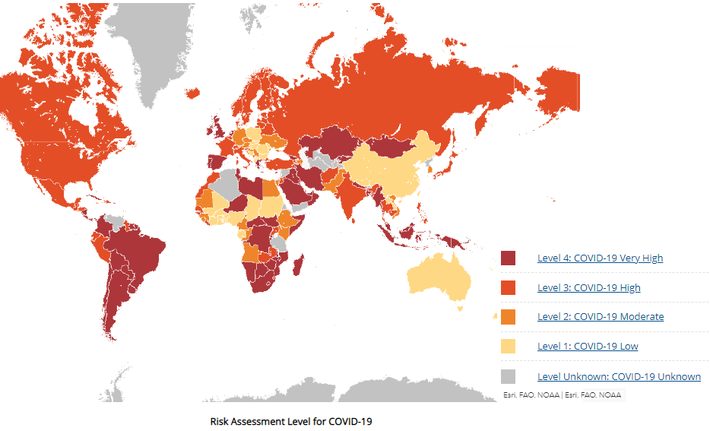
Significant amounts of data have been collected, analyzed, and reported globally since the start of the Covid-19 pandemic, leading to a better understanding of how the disease spreads. Much of this data has been analyzed with geospatial modeling, which finds patterns in data that includes a geospatial (map) component. The modeling technique uses Geographic Information System (GIS), originally developed in the 1960s to store, collate, and analyze data about land usage [1]. Since its inception, GIS has since been used in an ever-increasing range of applications including modeling of human behavior in a geospatial context. More recently, the tool has been applied to Covid-19 data to analyze how the disease spreads globally (across national borders) and locally (within borders).
The bulk of Covid-19 geospatial modeling research has focused on global concerns like international travel, the effectiveness of border closures, and the spread of disease in a specific country taken as a whole. Recently, studies have been applied at the local levelin cities, neighborhoods or specific rural areas. These local studies have revealed significant disparities in both Covid-19 testing and cases between different types of neighborhoods within cities; The results indicate that national border controls are not enough; the pandemic must also be tackled at a local level. Additionally, analysis has revealed that conclusions obtained from one country’s data cannot necessarily be applied to another country because of differences in social structures.
The Spread of Covid-19 Isnt Random
One ecological research paper [2], explored spatial inequities in COVID-19 confirmed cases, positivity, mortality, and testing in three U.S. cities for the first 6 months of the pandemic. The research concluded that socially vulnerable neighborhoodsthose suffering from residential segregation and with a history of systematic disinvestmenthad more confirmed cases, higher test positivity and mortality rates, and lower testing rates compared to less vulnerable neighborhoods.
A similar Canadian-based study [3] revealed that Social injustice, infrastructure, and neighborhood cohesion were characteristics of increasing incidence and spread COVID-19. Maps of locales showed that hotspots were more likely to be found in disadvantaged neighborhoods:
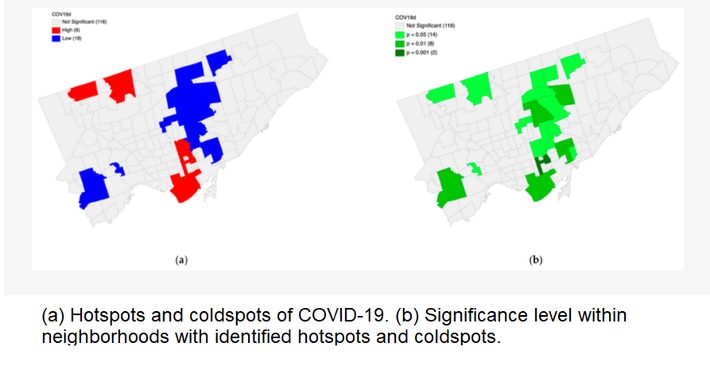
The study concluded that cases are not randomly spread but spatially dependent. In other words, your odds of contracting and dying of the disease is higher if you live in a socio-economically disadvantaged area. The study authors urge that is that a tailor-made monitoring and prevention strategygeared towards specific neighborhood issuesmust be applied to COVID-19 mitigation policies to guarantee control of the disease.
Covid-19 Data Cant be Generalized
Up until fairly recently, much of the pandemic modeling data came from China. However, while Covid-19 data from one country (in this case, China) may offer important insights about the spread of disease, its not always the case that those results will be applicable to other countries. This is likely because social and urban structures in China may be quite different from those in Europe and other countries.
One study using data from Catalonia, Spain [4], showed differing results when comparing global spatial autocorrelation between data from China and Catalonia, Spain. Spatial autocorrelation describes the degree to which spatial location values are similar to each other The study found that the results from Catalonia showed no spatial autocorrelation with regards to Covid-19 statistics (with one minor exception), while studies using Chinese data showed strong spatial autocorrelation levels. In addition to differences between social constructs, one reason for the disparity may be that the Chinese data was gathered from a huge geographical area, so may have suffered from scale effect.
The Catalonia study concluded that there may be a spatial random pattern of positive cases. However, the authors noted a few anomalies that indicated the possibility of hidden local spatial autocorrelation for specific areas.
All three studies concluded that patterns of Covid-19 spread warrants measures to contain the virus on a local level (like city or town) as well as a global level. In other words, border controls are not enough to contain the virus unless resources target regional hotspots as well.
References
[2]A first insight about spatial dimension of COVID-19: analysis at mu…
[3] Spatial Inequities in COVID-19 Testing, Positivity, Confirmed Cases…