
Elements For a Successful Cloud Deployment
The process of installing an application on the cloud using one or more models such as software as a service (SaaS), platform as a service… Read More »Elements For a Successful Cloud Deployment

The process of installing an application on the cloud using one or more models such as software as a service (SaaS), platform as a service… Read More »Elements For a Successful Cloud Deployment

Cloud computing has and continues to gain momentum in the market and understandably so. After all, this technology has made business operations significantly easier, especially… Read More »Microsoft Azure: IaaS vs PaaS: All You Need to Know

Companies and businesses across the broad spectrum of industries today are growing and evolving at a rapid pace. Unfortunately, this growth is often hampered by… Read More »Azure Synapse Analytics: Reasons Why You Need It

There’s a change foot in the media and entertainment industry, and we have artificial intelligence (AI) to thank for it. The global industry is utilizing the power of AI to make visual content more interactive and exciting. It helps to serve the audience to personalize content reach while enhancing the viewing experience that is more interesting and entertaining.

Node.js and Python are the most popular technologies for backend development. And, when it comes to web development, it could be challenging to choose between Node.js & Python. The selection of the right technology stack for your project is critical. This is primarily dictated by the project’s cost, launch timeline & how efficient it is to maintain and scale.

Representation of data using graphics such as charts, plots, infographics, heat maps, bubble clouds, scatter plots, mekko charts, animation, etc., is termed data visualization. Such visual displays and representation of information help communicate complex data relationships and data-driven insights in a way that makes it easy to understand and base decisions on.

Application refactoring can often be radically simplified by using cloud components.

Endpoint security is vital for cloud computing. Tracking and applying security protocols across the device is an ongoing process; regular checkups, in the form of… Read More »Cloud Security for Healthcare Sector: All You Need to Know

Banks and financial organizations continue to face myriad challenges in the market, such as data privacy concerns, accessibility to crucial banking data, and demand for… Read More »Banking and Financial Sector: Key Benefits of the Multi-Cloud Approach
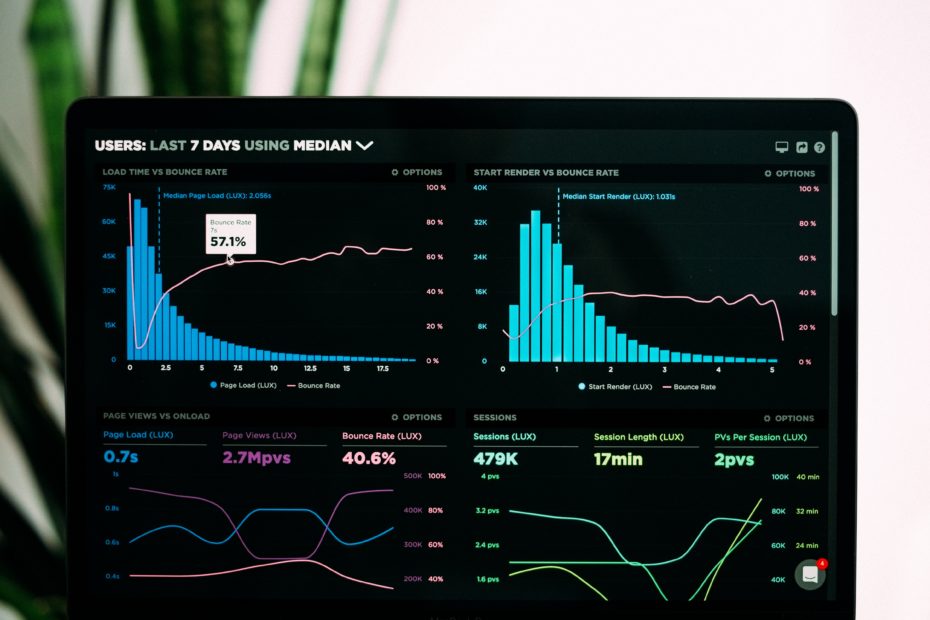
Data representation using graphics such as charts, plots, infographics, heat maps, bubble clouds, scatter plots, mekko charts are referred to as data visualization. Such visual displays and representations of information help communicate complex data relationships and data-driven insights in a way that makes it easy to understand and base decisions on.