
Summary: Reinforcement Learning (RL) is likely to be the next big push in artificial intelligence. It’s the core technique for robotics, smart IoT, game play, and many other emerging areas. But the concept of modeling in RL is very different from our statistical techniques and deep learning. In this two part series we’ll take a look at the basics of RL models, how they’re built and used. In the next part, we’ll address some of the complexities that make development a challenge.
Now that we have pretty much conquered speech, text, and image processing with deep neural nets, it’s time to turn our attention to what comes next. It’s likely that the next most important area of development for AI will be reinforcement learning (RL).
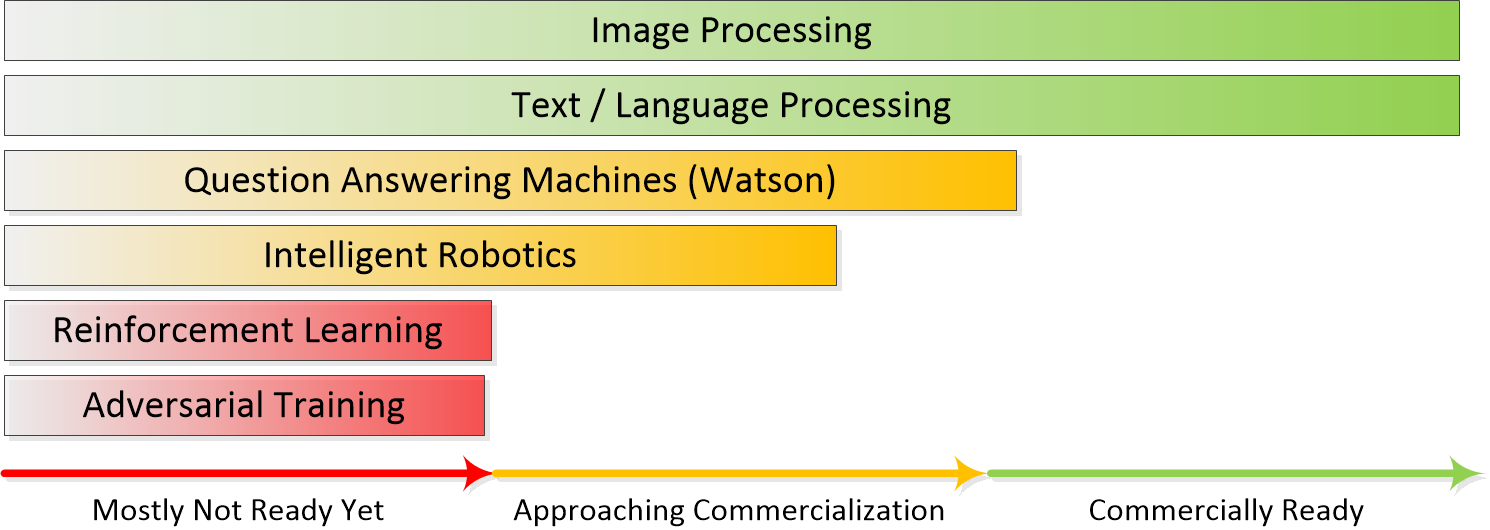
RL systems are getting a lot of play in the press from self-driving cars and winning at Go but the reality is that they are not quite yet ready for commercialization. We wrote about the readiness of the various techniques behind AI earlier and published this chart.
Why So Important?
The reason that reinforcement learning will be so important going forward is that it has so many applications that are not addressed by any other techniques. Specifically RL is what enables all of robotics and will enable smart IoT.
Brandon Rohrer is both a Senior Data Scientist at Microsoft and also a prolific explainer of all things data science. In one remarkable article he lists the 96 most common question categories addressed by data science and techniques most likely to solve them. Although the great majority of our work is still in predicting consumer behavior, Brandon shows that RL is or will be the preferred technique to address 10 of the 96. That’s a huge percentage for a technique that’s just beginning to come into its own. Here’s his list of questions for RL.
- Which offer should this customer receive?
- Which advertisement should be listed first for this reader?
- Where should I place this ad on the webpage so that the viewer is most likely to click it?
- How many shares of this stock should I buy right now?
- Should the robot vacuum clean the living room or continue to charge?
- Do I move this obstacle or navigate around it?
- Should the thermostat adjust the temperature higher, lower, or leave it where it is?
- Should I continue driving at the same speed, brake, or accelerate in response to that yellow light?
- What is the translation of this sentence from English into Chinese?
- In which direction should this robot move given what it sees?
Yes for each of these 10 there’s at least one alternative in classical predictive analytics but Brandon proposes that RL will be the superior choice in these cases.
Remember that the unique feature of RL is that it learns from trial and error which makes it quite different from all the other statistically based techniques at our disposal. Some have likened RL to Groundhog Day for algorithms.
Most importantly it puts it in a completely separate category from supervised and unsupervised learning. It’s going to be your go-to when:
- Data for learning currently does not exist.
- Or you don’t want to wait to accumulate it (because delay might be costly).
- Or the data may change rapidly causing the outcome to change more rapidly than a typical model refresh cycle can accommodate.
Different from Supervised and Unsupervised
It’s only been a few years since RL was identified as a third leg of analytics differentiating it from supervised and unsupervised learning. RL systems are simple in the sense that no statistical training on labeled data is required. In fact RL occupies a middle ground between supervised and unsupervised learning.
Where supervised learning has target labels for each observation and unsupervised has none, reinforcement learning needs labels only for the actions that we want to reward. During training the vast number of examples are likely to be unsuccessful and therefore don’t need a label. Only those actions that we want to reward (or discourage) that direct the agent how to behave in the environment need to be labeled. So these labels are going to be sparse, and in many situations, time-delayed.
Under the Hood with Reinforcement Learning
In this article we’ll take a look at what’s under the hood in RL.
- How RL models are constructed.
- What they look like.
- How they are interpreted
In a follow-on article we’ll address many of the complexities and challenges involved in actual implementation.
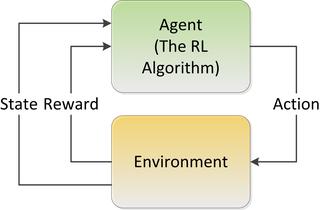
We assume that you’re familiar with the basic schema of RL and can understand the roles of goals, sensors, actuators, the environment (the world and its ‘state’), actions, and rewards.
If not, you may want to first read our introductory article which serves as a foundation for this one.
Throughout we will use the concept of State / Action pairs and Policy. The ‘policy’ is the highest value ‘action’ that can be taken given the ‘state’ (the current condition of the system and all its parts) looking typically just one step ahead. The value of that ‘policy’ is calculated by the Q-function (determining the value of the next step) which is written Q(s,a), the maximum discounted future reward when we perform action a in state s.
Building a Basic RL Model
Unlike statistically based modeling where the output of training on existing data is an algorithm that can be used to score or categorize unseen data, the core of the RL model is simply a very large table in which each iteration of the action is recorded along with the outcome. Given enough iterations of the action, the table will represent the probability that each of the actions attempted was successful or unsuccessful.
To illustrate how such a table might be built we’ll use a very simplified example based on the problem of maintaining the temperature of an automated house where we’ll show only a very small portion of the overall table. This particular example also comes from Brandon Rohrer who has a great explainer video.
The goal: Move the house from its current temperature of 68 degrees to 70 degrees.
Sensor: Thermometer in the thermostat.
Actuator: The heater.
Possible actions (the decision): The heater may be turned on or left off. In this portion of the table the heater is on or off for 10 minutes and measured at the end of each interval.
So our table represents what are essentially tests of what happens recording the temperature before, the temperature after, and whether the heater was on or off. For each set of conditions we’ll note the number of times it occurs and continuously update the probability of that outcome. In this table we have 758 observations (a little over 5 days) with roughly equal examples of the heater on and off.
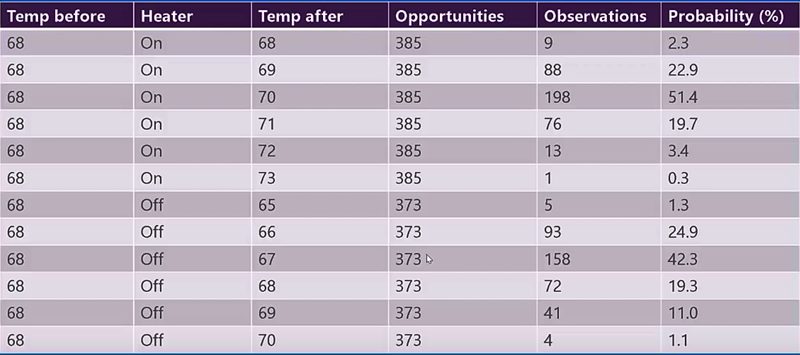
Brandon Roher, How reinforcement learning works in Becca 7
To use this as a model, we simply look up all the instances in which the starting temperature was 68 and the goal temperature of 70 was successfully achieved.
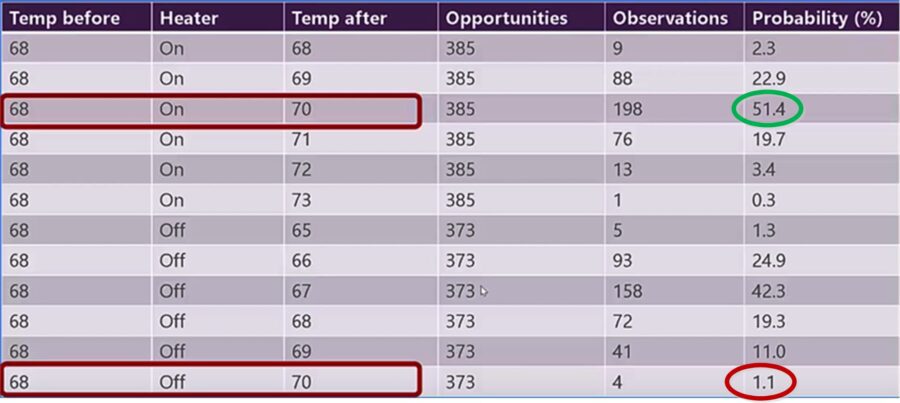
Brandon Roher, How reinforcement learning works in Becca 7
There are two instances of this, one with the heater on and one off. Based on the probability our RL system would decide to turn on the heater for 10 minutes since the probability of success for that action is almost 50X higher than for leaving it off.
Wait – What About…
I’m sure you observed that the real table is much, much larger. For starters the table would have to include all the reasonable starting and ending temperatures between perhaps 50 and 100 degrees even though many of those rows might be empty. Here are just a few other conditions we might need to incorporate into the table.
- If the heater is cycled for more or less than 10 minutes, perhaps in increments of 5 minutes of up to 30 minutes each would need its own entry.
- What about reducing temperature? There need to be entries for when the AC is activated to reduce temperature.
- What about time of day? We probably need several different tables that account for day, night, and whether we’re home.
- What about factors that work together like heat and humidity? If we’re heating a house in the winter and we add humidity then our perception of comfortable temperature changes. The interaction between these variables would be complex and would require two sensors and a formula interrelating the two variables. The goal would also change from an exact temperature to some other measure indicating ‘comfort’ when combining temperature and humidity.
- What about other actuators like automatically opening and closing the shades?
You begin to see the pattern. Anytime we increase complexity the table expands. When we add sensors or actuators we’re basically multiplying the size of the table by the number of sensors and actuators. Pretty soon this gets into Big Data territory.
Tables or Calculation – Look Up or Neural Nets
For relatively simple environments like our automated house, the math in the table itself is quite simple and the probability can be recalculated on the fly with very few resources. Simple RL systems are not compute intensive, they are look up intensive. Fortunately in this era of Big Data rapid look up is easy and inexpensive.
It’s likely that the table will be sparse so a column-based NoSQL scheme like Hbase would be efficient and could also be condensed, reducing storage size.
However as the state space grows in size and complexity it’s not practical to store a Q factor for every State / Action pair. What we can do instead is to train a neural net, typically a convolutional neural net (CNN) to calculate the Q factor on the fly and store a limited number of those in a table.
However, these aren’t the only complexities facing building RL systems. Although the core concept is really this simple, actual implementation is another matter. In our next article we’ll explore several of them.
Other Articles in this Series
Reinforcement Learning Part 3 – Challenges & Considerations
About the author: Bill Vorhies is Editorial Director for Data Science Central and has practiced as a data scientist since 2001. He can be reached at: